
October 2020
Investment Overview
As the third quarter ended, the Country and the entire world continue to face a growing list of unprecedented challenges 2020 has brought to us. The Covid19 pandemic is still raging, and over 210,000 Americans have died from the coronavirus as October begins; the West Coast is reeling from the worst fire season in U.S. history; a historically bad hurricane season has created the most named storms ever recorded; and now the U.S. president has contracted the coronavirus himself. The national mood is a strange mix of fear, anxiety and the united opinion that 2020 has been awful for most.
With all the challenges of 2020, we are pleased to announce that our proprietary equity strategies have continued to outperform stock markets by a wide margin. The green investment strategies we launched last October have reached their one-year mark and each of the 3 equity strategies have produced impressive results. Our U.S. Equity strategy has gained 28.99% vs a 12.98% gain for the S&P 500 Index during the same period. Our Global Equity strategy has gained 37.98% in its first year, nearly tripling the returns of the S&P 500 Index and over 27% above the returns of the MSCI All Country World Index, which has gained 10.59% in the last 12 months. Our Blended Equity strategy, which is designed to invest in the best ideas from the other 2 equity strategies, has gained 31.16% in its first year. More details about our performance record are shown below and at our website, www.ebertcapital.com.
The economy and the global stock market have not fared nearly as well as our strategies for important reasons. First, stock markets represent the aggregate, asset-value-weighted returns of publicly traded stocks. This is important to understand in a year when small businesses are being devastated by the pandemic-induced recession. Although many economists estimate that more than 50% American employees are employed by small businesses, no small business is publicly traded. Another element of the U.S. stock market unknown to many is that, because the U.S. market is market cap weighted (larger companies make up a larger proportion of the market’s value) about 23% of the value of the S&P 500 is made up of just 5 companies. Apple, Microsoft, Amazon, Google and Facebook are giant and each have recurring revenue business models that offer services that are unlikely to be canceled, even during a pandemic. In fact, recurring revenue tech companies often have these business models and that is a main reason why the tech sector is nearly 30% of the value of the S&P 500, according to Fidelity. In fact, S&P, the company that owns and operates the S&P 500 and many other stock indices, moved many tech companies to other sectors in 2018 because tech was basically becoming the entire market.
If that adjustment had not been made – where tech giants like Amazon were moved the Consumer Discretionary sector and Google and Facebook were moved to the Communications Services Sector – we estimate that close to 50% of the S&P 500’s value would be in the tech sector. Because nearly 50% of the U.S. stock market is tech stocks, it’s no wonder the stock market doesn’t represent the economy as whole. Why is this? It’s because many tech business models are simply faster growing and more profitable than many other business models. More importantly though, the U.S. economy is changing at a rapid pace and becoming a more technology dominated economy.
Netflix is tech company – but really it’s a media company that’s replaced old media companies that are dying or out of business such as drive-ins, movie theaters, basic cable etc. Microsoft is a tech company, but really it’s a company that dominates in many arenas such as business services, data storage, computer operating systems, online media, video games and more. Amazon is a tech company, but in reality it’s a store where we buy products and has replaced older businesses that are dying or extinct such as bookstores, clothing stores, malls, etc. Because of the recognition that these tech companies aren’t tech companies so much as product and service companies that represent how our economy has been changing over the last 10 to 20 years, S&P has moved many of the largest, most successful companies to some of the 11 non-tech sectors of the S&P 500.
We own many of these companies because their business models and growth prospects, we feel, will better allow our clients’ investment accounts to grow. As the pandemic has continued, the economic devastation has spread and we feel this will continue at least until a vaccine is widely adopted and for some business sectors – there may never be a rebound. We think many of the trends we’ve seen over the course of the pandemic will continue if not accelerate. Telemedicine, remote work, digitization, clean energy transitions, self-driving vehicles, software as a service, etc. were all trends growing rapidly before 2020 and we think many of these trends will define the next decade plus.
On the other hand, many business models that were being ditched by consumers before 2020 have continued to devolve at fast rates. People are traveling less, buying more online, consuming more mobile media, working from home more often and avoiding crowded spaces. This has led to epic job losses for restaurants, airlines, theme parks, hotels, malls and retailers. Many of these trends will turn around “when this is over”, but the pandemic has magnified the weaknesses of business models where consumers can simply decide not to buy services, products and experiences from these businesses. Conversely, people stopped going to movie theaters, but are unlikely to cancel Netflix after the pandemic ends; business are unlikely to cancel their Docusign service and go back to mostly paper signatures next year; cities and states are less likely to move away from automation and digitization when we return to “normal”. This is why we think we can continue performing very well for our clients well into the future.
Stock Highlights
Company: NVIDIA Corp.
Industries: Artificial Intelligence, Semiconductors, Data Centers
Portfolio: Blended Equity, Global Equity
Company Overview - AI computers write their own software and make their own decisions without human input. If that sounds very futuristic it’s because it is. NVIDIA makes the most advanced technology on the market today and their solutions power self-driving vehicles, crypto currency processing equipment, face recognition, voice recognition, and many other applications. NVIDIA began by revolutionizing the gaming industry, and the most popular games in the industry, including Fortnite, utilize NVIDIA gaming chips. The fastest growing segment of the product line is Artificial Intelligence (AI) chips, which are used for autonomous vehicles as well as face and voice recognition software. NVIDIA derives revenue from product sales of hardware, license and development, and software licensing.
Financial Highlights - In the trailing 12 months NVIDIA made $13.1 billion in revenue and a 20% growth rate in the last 3 quarters. This is up from sales of $6.9 Billion in 2017. Annually the company is projected to grow around 30% a year. The company has a gross profit margin of 62.84% and a net profit margin of 25.94%, leading to earnings per share of $5.44. NVIDIA is doing extremely well during the pandemic, spurred by 169% year-over-year growth in data center revenue. The company’s high growth and profitability rates make it one of the strongest companies in the Country.
Investment Thesis - ECM purchased NVIDIA for a variety of reasons. This company is a leader in every product line they have entered. NVIDIA is the market leader in Gaming Technology, AI Technology, semiconductor chips and they stand to benefit the most from the certain adoption of these technologies all over the world. NVIDIA also appealed to us because of the high growth rate and the very high 26% net profit margin. Profit margins of this magnitude are rare and profit margins of 20% or higher are only achieved by companies with the best business models.
Company: Teladoc Health Inc.
Industries: Healthcare Technology
Portfolio: U.S. Equity
Company Overview - At a time when staying at home is recommended by health experts, a doctor visit now often means talking to the doctor virtually and remotely. Enter Teladoc Health Inc., a provider of virtual healthcare services that enables patients to receive medical advice and services without an in-person visit to the doctor. Experts predict that this sort of virtual experience in healthcare will continue to grow rapidly over the next decade. As of early 2020 Teladoc has 36.7 million U.S. paid members and an additional 19.3 million fee-per-visit members. These numbers are going to increase substantially when the company reports full year 2020 numbers in early 2021.
Financial Highlights - Teladoc Health has done $716.30 million in revenue in the last 12 months, increasing from $553.30 million at the end of 2019. This rapid growth in 2020 is due to the services of Teladoc being adopted on a large scale due to the Covid19 pandemic. Teladoc has $1.30 billion in total equity and is expanding its balance sheet to fund its reinvestment into the business, leading to the rapid growth we are seeing today. Teladoc has also issued new shares to fund the very same growth. This is very positive as the company’s rapid growth rate makes this large reinvestment very lucrative. We often see large expansion of balance sheets and increased share counts from companies that are doing very poorly, meaning they are funding their demise with shareholder money. It is wonderful to see a company that is using shareholder money to increase revenues and profitability the correct way, and good management means that the proper decisions are being made on a consistent basis.
Investment Thesis - The best part of Teladoc’s business model is that their service is perfectly scalable, with minimal capital outlay. This means that as the business grows, the profit margin will grow faster than sales due to the low incremental cost associated with running the service. This also means that the company can grow rapidly without large capital expenditures. For example, when a mining or oil company expands, they need massive capital expenditures in order to increase their sales due to the high cost of land and industrial output needed to capture the commodities they need to sell. Teladoc doesn’t have any of these constraints because in order to expand they just need to license their software to more customers, which doesn’t require large additional capital outlays. We expect the company to become very profitable in the future as their revenue grows rapidly. We have a target price for Teladoc of $225.00, which we expect the firm to hit within the next 3 months. The target price is based off of analysis by Credit Suisse in which they site expected EPS of $1.39 by 2022.
Disclaimer/Disclosure
The purpose of this newsletter is to explain what is happening with our investment strategies and our current views on the markets. We do not sell our investment report and it is intended only as a communication device. The information in this report should not be considered a recommendation to purchase or sell any particular security. There is no assurance or guarantee that the securities discussed herein will remain in an account’s portfolio at the time this report is received. The securities discussed do not represent an account’s entire portfolio and may only represent a small percentage of an account’s portfolio. It should not be assumed that any of the securities discussed were or will prove to be profitable, or that the investment recommendations or decisions ECM makes in the future will be profitable or will equal the investment performance of the securities discussed herein.
ECM uses certain proprietary databases, formulas and devices in its investment decision process. The use of these devices does not change the possibility of loss inherent in all investment decisions.
Performance

Our U.S. Equity strategy invests in U.S. companies with significant competitive advantages, barriers to entry, preferably a recurring revenue model, and tends to perform well during market selloffs. We only select the most dominant companies in their field. The desired holding period is long term, hopefully perpetually. This strategy consists of U.S. stocks only and is benchmarked to the S&P 500 Index. The U.S. Equity Strategy consists of all accounts that hold U.S. stocks of any market capitalization above $50 million. The composite creation date is 10/01/2019.
Returns are presented net and gross of actual management fees paid. Fees are described on the last page of this report and apply to all composites managed by Ebert Capital Management Inc. ECM’s account inclusion policy is the first full month or the end of the month in which the account is fully invested. The composite contains both taxable and nontaxable accounts. The returns of the individual portfolios within the composite are time-weighted, use trade date accounting, are based upon monthly portfolio valuations, and include the reinvestment of all earnings as of the payment date. The composite returns are asset-weighted based upon the beginning period market values calculated in U.S. dollars. Three-year ex post standard deviation for composite and benchmark is not present if 36 monthly returns are unavailable. A dispersion measure is not shown when there are five or fewer accounts in the composite for the entire year. The internal dispersion is calculated using the asset-weighted standard deviation of annual net returns of those portfolios that were included in the composite. The composite contained fewer than 1% of non-fee paying accounts at the end of each year.
Ebert Capital Management Inc. (ECM) is an independent, fee-only registered investment adviser. Ebert Capital Management claims compliance with the Global Investment Performance Standards (GIPS®) and has prepared and presented this report in compliance with the GIPS standards. Ebert Capital Management has been independently verified for the periods Dec 1, 2010 through December 31, 2013. The verification report is available upon request. A firm that claims compliance with the GIPS standards must establish policies and procedures for complying with all the applicable requirements of the GIPS standards. Verification provides assurance on whether the firm’s policies and procedures related to composite and pooled fund maintenance, as well as the calculation, presentation, and distribution of performance, have been designed in compliance with the GIPS standards and have been implemented on a firm-wide basis. Verification does not provide assurance on the accuracy of any specific performance report. GIPS® is a registered trademark of CFA Institute. CFA Institute does not endorse or promote this organization, nor does it warrant the accuracy or quality of the content contained herein. Policies for valuing portfolios, calculating performance, preparing GIPS Reports, and a list of composite descriptions are available upon request.
Past performance does not guarantee future results. Performance data quoted represents past performance. Current performance may be lower or higher than the performance data quoted. Past performance of markets, strategies, composites, or any individual securities is no guarantee of future results. Different types of investments involve varying degrees of risk, and there can be no assurance that any specific investment will either be suitable or profitable for a client’s portfolio. Investment in the above referenced model composite is subject to investment risks, including, without limitation: market risk, interest rate risk, management style risk, business risk, sector risk, and other risks related to equity securities. There are no assurances that a portfolio will match or outperform any particular benchmark. Historical performance results for benchmarks, such as investment indices and/or categories, generally do not reflect the deduction of transaction and/or custodial charges or the deduction of an investment-management fee, which would have the effect of decreasing historical performance results.
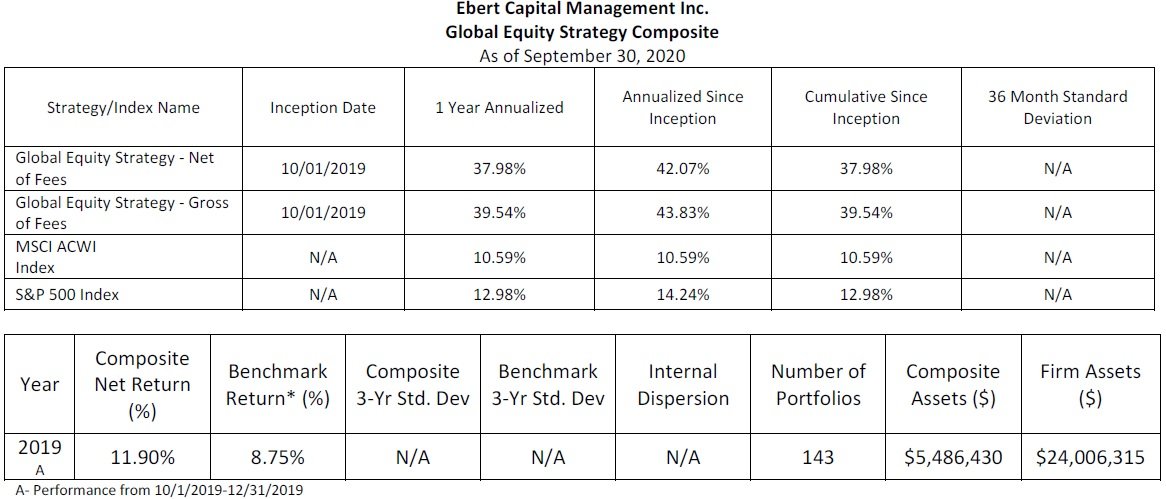
Our Global Equity strategy invests in companies with at least 50% of revenues outside the U.S. or significant operations outside the U.S. The strategy invests in companies with significant competitive advantages, barriers to entry, preferably a recurring revenue model, and tends to perform well during market selloffs. We only select the most dominant companies in their field. The desired holding period is long term, hopefully perpetually. This strategy consists of U.S. Stocks with revenues of 50% or greater coming from outside the U.S. or significant operations outside the U.S. and non-U.S. stocks and is benchmarked to the MSCI ACWI (All Country World) Index. The composite creation date is 10/01/2019.
Returns are presented net and gross of actual management fees paid. Fees are described on the last page of this report and apply to all composites managed by Ebert Capital Management Inc. ECM’s account inclusion policy is the first full month or the end of the month in which the account is fully invested. The composite contains both taxable and nontaxable accounts. The returns of the individual portfolios within the composite are time-weighted, use trade date accounting, are based upon monthly portfolio valuations, and include the reinvestment of all earnings as of the payment date. The composite returns are asset-weighted based upon the beginning period market values calculated in U.S. dollars. The composite contained fewer than 1% of non-fee paying accounts at the end of each year.
Ebert Capital Management Inc. (ECM) is an independent, fee-only registered investment adviser. Ebert Capital Management claims compliance with the Global Investment Performance Standards (GIPS®) and has prepared and presented this report in compliance with the GIPS standards. Ebert Capital Management has been independently verified for the periods Dec 1, 2010 through December 31, 2013. The verification report is available upon request. A firm that claims compliance with the GIPS standards must establish policies and procedures for complying with all the applicable requirements of the GIPS standards. Verification provides assurance on whether the firm’s policies and procedures related to composite and pooled fund maintenance, as well as the calculation, presentation, and distribution of performance, have been designed in compliance with the GIPS standards and have been implemented on a firm-wide basis. Verification does not provide assurance on the accuracy of any specific performance report.
GIPS® is a registered trademark of CFA Institute. CFA Institute does not endorse or promote this organization, nor does it warrant the accuracy or quality of the content contained herein. Policies for valuing portfolios, calculating performance, preparing GIPS Reports, and a list of composite descriptions are available upon request.
Past performance does not guarantee future results. Performance data quoted represents past performance. Current performance may be lower or higher than the performance data quoted. Past performance of markets, strategies, composites, or any individual securities is no guarantee of future results. Different types of investments involve varying degrees of risk, and there can be no assurance that any specific investment will either be suitable or profitable for a client’s portfolio. Investment in the above referenced model composite is subject to investment risks, including, without limitation: market risk, interest rate risk, management style risk, business risk, sector risk, and other risks related to equity securities. There are no assurances that a portfolio will match or outperform any particular benchmark. Historical performance results for benchmarks, such as investment indices and/or categories, generally do not reflect the deduction of transaction and/or custodial charges or the deduction of an investment-management fee, which would have the effect of decreasing historical performance results.

Our Blended Equity Strategy is composed of a mix of our U.S. Equity investments and our Global Equity investments. The purpose of this strategy is to hold stocks of high quality companies that maintain significant competitive advantages over their peers, barriers to entry, preferably with a recurring revenue model, and tends to perform well during market downturns. We only select the most dominant companies in their field. The desired holding period is long term, hopefully perpetually. The strategy is benchmarked to the MSCI ACWI. The composite creation date is 10/01/2019.
Returns are presented net and gross of actual management fees paid. Fees are described on the last page of this report and apply to all composites managed by Ebert Capital Management Inc. ECM’s account inclusion policy is the first full month or the end of the month in which the account is fully invested. The composite contains both taxable and nontaxable accounts. The returns of the individual portfolios within the composite are time-weighted, use trade date accounting, are based upon monthly portfolio valuations, and include the reinvestment of all earnings as of the payment date. The composite returns are asset-weighted based upon the beginning period market values calculated in U.S. dollars. The composite contained fewer than 1% of non-fee paying accounts at the end of each year.
Ebert Capital Management Inc. (ECM) is an independent, fee-only registered investment adviser. Ebert Capital Management claims compliance with the Global Investment Performance Standards (GIPS®) and has prepared and presented this report in compliance with the GIPS standards. Ebert Capital Management has been independently verified for the periods Dec 1, 2010 through December 31, 2013. The verification report is available upon request. A firm that claims compliance with the GIPS standards must establish policies and procedures for complying with all the applicable requirements of the GIPS standards. Verification provides assurance on whether the firm’s policies and procedures related to composite and pooled fund maintenance, as well as the calculation, presentation, and distribution of performance, have been designed in compliance with the GIPS standards and have been implemented on a firm-wide basis. Verification does not provide assurance on the accuracy of any specific performance report.
GIPS® is a registered trademark of CFA Institute. CFA Institute does not endorse or promote this organization, nor does it warrant the accuracy or quality of the content contained herein. Policies for valuing portfolios, calculating performance, preparing GIPS Reports, and a list of composite descriptions are available upon request.
Past performance does not guarantee future results. Performance data quoted represents past performance. Current performance may be lower or higher than the performance data quoted. Past performance of markets, strategies, composites, or any individual securities is no guarantee of future results. Different types of investments involve varying degrees of risk, and there can be no assurance that any specific investment will either be suitable or profitable for a client’s portfolio. Investment in the above referenced model composite is subject to investment risks, including, without limitation: market risk, interest rate risk, management style risk, business risk, sector risk, and other risks related to equity securities. There are no assurances that a portfolio will match or outperform any particular benchmark. Historical performance results for benchmarks, such as investment indices and/or categories, generally do not reflect the deduction of transaction and/or custodial charges or the deduction of an investment-management fee, which would have the effect of decreasing historical performance results.

The Conservative Income Strategy consists of all accounts that hold bond ETFs selected with the aim of providing principal protection and income using low-cost bond index ETFs of varying maturity and bond quality and a small allocation to stocks. The composite creation date is 8/1/2011.
Returns are presented net and gross of actual management fees paid. Fees are described on the last page of this report and apply to all composites managed by Ebert Capital Management Inc. ECM’s account inclusion policy is the first full month or the end of the month in which the account is fully invested. The composite contains both taxable and nontaxable accounts. The returns of the individual portfolios within the composite are time-weighted, use trade date accounting, are based upon monthly portfolio valuations, and include the reinvestment of all earnings as of the payment date. The composite returns are asset-weighted based upon the beginning period market values calculated in U.S. dollars. The Benchmark for the composite is the Barclays Capital U.S. Aggregate Bond Index, presented in U.S. dollars. The composite contained fewer than 1% of non-fee paying accounts at the end of each year.
Ebert Capital Management Inc. (ECM) is an independent, fee-only registered investment adviser. Ebert Capital Management claims compliance with the Global Investment Performance Standards (GIPS®) and has prepared and presented this report in compliance with the GIPS standards. Ebert Capital Management has been independently verified for the periods Dec 1, 2010 through December 31, 2013. The verification report is available upon request. A firm that claims compliance with the GIPS standards must establish policies and procedures for complying with all the applicable requirements of the GIPS standards. Verification provides assurance on whether the firm’s policies and procedures related to composite and pooled fund maintenance, as well as the calculation, presentation, and distribution of performance, have been designed in compliance with the GIPS standards and have been implemented on a firm-wide basis. Verification does not provide assurance on the accuracy of any specific performance report.
GIPS® is a registered trademark of CFA Institute. CFA Institute does not endorse or promote this organization, nor does it warrant the accuracy or quality of the content contained herein. Policies for valuing portfolios, calculating performance, preparing GIPS Reports, and a list of composite descriptions are available upon request.
Past performance does not guarantee future results. Performance data quoted represents past performance. Current performance may be lower or higher than the performance data quoted. Past performance of markets, strategies, composites, or any individual securities is no guarantee of future results. Different types of investments involve varying degrees of risk, and there can be no assurance that any specific investment will either be suitable or profitable for a client’s portfolio. Investment in the above referenced model composite is subject to investment risks, including, without limitation: market risk, interest rate risk, management style risk, business risk, sector risk, and other risks related to equity securities. There are no assurances that a portfolio will match or outperform any particular benchmark. Historical performance results for benchmarks, such as investment indices and/or categories, generally do not reflect the deduction of transaction and/or custodial charges or the deduction of an investment-management fee, which would have the effect of decreasing historical performance results.
Standard Fee Schedule for all composites.
Assets Under Management ($)
Annual Fee (%)
First $250,000
1.50%
Next $250,000
1.25%
Next $500,000
1.00%
Next $1,000,000
0.75%
Over $2,000,000
0.50%