April 2024
INVESTMENT OVERVIEW
The U.S. stock market and ECM's investment strategies continued to perform very well during the first quarter of 2024, showing similar performance to the first quarter of 2023. For the first quarter, the S&P 500 Index gained 10.55%, the Nasdaq 100 gained 10.57%, the Dow Jones Industrial Average gained 6.14% and the All-Country World Index excluding the U.S. earned a return of 4.65%. We continued to see significant outperformance from our Blended Equity and Global Equity strategies, which have earned returns of 18.93% and 22.96%, year to date, net of fees. Overall, we are very pleased with the returns of our equity strategies, with our Diversified Growth, Conservative Growth, Blended Equity and Global Equity strategies providing significant outperformance vs the S&P 500 Index since inception. Our U.S. Equity strategy, which has much more Small Cap stock exposure than the other strategies, has continued to lag the more Large Cap focused strategies. However, with a strengthening U.S. economy, unemployment remaining low and inflation rates continuing to decline, we expect the U.S. Equity strategy to provide strong long-term growth going forward. Sources: S&P Global, Blackrock.
Looking back again to 2022 and 2023, there are stark differences with the U.S. and global economy, the global growth trajectory, and expectations for the Federal Reserve's interest rate plans here in the U.S. In 2022 interest rates were near zero, inflation was at a multi-decade high, and the world was still emerging from the pandemic, with all the supply chain, high demand and production challenges that come from the global economy going from a dead stop to a full tilt restart. 2023 provided our clients with a massive performance rebound as the U.S. stock market produced one of its best years ever. This was to be expected, as we told our clients, because it's normal for the market's best years to be rebound years from historic declines. During 2023, the U.S. economy began to strengthen, the Federal Reserve continued its most aggressive rate hikes in U.S. history and the public began to see artificial intelligence as one of the biggest changes to ever happen to the U.S. economy. The interest rate hikes caused suffering in real estate and other areas of the economy most exposed to interest rate risk, but the largest, most profitable, highest quality U.S. businesses have been largely unaffected by higher interest rates.
Now, one quarter into 2024, markets are at all-time highs and stock valuations are among the most expensive ever after a historic market rally that has run from Halloween 2023 through the first quarter. The market's optimism is warranted given the strengthening economy, record corporate earnings and the promise of artificial intelligence driving economic production. However, we are feeling very cautious about the current valuations of U.S. stocks, and we have been keeping our stock purchases to a bare minimum for our clients over the past few months. We have not been selling stocks since we feel very confident in the high quality of the stocks and ETFs in our strategies. We also don't attempt to time markets since that's an impossible task best to be avoided. However, we do tell clients when we are getting chocolate candy and cookie deliveries and thank you notes, it's likely that stocks are very expensive. When investors are worried, scared and it seems all hope is lost, then it's likely that there's a great buying opportunity in the market.
Since we've been getting plenty of thank you notes and cookie and chocolate deliveries, we've been holding a majority of new deposits in risk free investments like money market funds, ultra short-term T Bills and cash or cash-like investments. For our clientele and equity strategies as a whole, we've mostly been only nibbling at stocks when the market has provided bad days or bad weeks and we'll continue buying conservatively until the market provides a bit of a market correction. It's odd to hear from a portfolio manager, but we are hoping for a bit of a market correction so we can buy stocks and ETFs at lower valuations. To put it another way, we'd like to make our biggest stock and ETF purchases when the market, clients and investors are more worried and scared than they are now. If we get a more significant market correction and market commentators give the "all hope is lost" message, our clients know we'll continue buying high quality stocks aggressively during such a period.
For now, we are content with our portfolio mix, we have removed the lowest quality stocks and added some great businesses to our investment strategies over the past year and we'll buy prudently if and when the market gets uglier than its current state where buying opportunities have been few and far between for many months.
Finally, looking at interest rate and economic expectations, the Federal Reserve has become much more cautious about reducing interest rates this year because of recent inflation reports. The Fed seeks a 2% annualized inflation rate, but inflation - having come down from double digits in 2021-2022 - has been "sticky" at around a 3.2% year over year rate. By any metric, the economy is strong and likely doesn't truly "need" lower interest rates and the Fed's theory is that keeping interest rates higher for lower will reduce price expansion in the various metrics that make up their inflation calculations. The market and economy, seemingly, had been married at the hip with the Fed's interest rates for many years. But that correlation has imploded recently as unemployment has remained low, GDP growth strong, economic activity remains high and the stock market is near all-time highs. This suggests that the economy doesn't really need the Fed to reduce interest rates until some economic weakness overcomes the desire to keep inflation low. During higher interest rate periods, we believe the best companies to invest in are the healthiest and most profitable companies that display durable competitive advantages over peers; companies with recurring revenue models, low debt requirements and that offer services their customers truly need. We feel our investment strategies own companies that meet these criteria. Source: tradingeconomics.com

Overview: As the top performing stock in our portfolios, we have written about NVIDIA many times in the last few years. We are writing about NVIDIA again because the company continues to transform the Artificial Intelligence (AI) industry. NVIDIA recently launched its Blackwell AI Architecture, new GPU architecture with advanced computing and Generative AI features. The Blackwell platform allows others to build complex AI products and is the backbone for how these programs are built and launched. Blackwell is Nvidia’s latest innovation that is further separating the company from competitors. The platform allows users accelerated computing that can be used for large language models, drug discovery, engineering simulation and many other uses.
Financial Highlights: NVIDIA is in a Supercycle growth phase right now, with explosive growth coming every quarter. Just over one year ago, in January 2023 NVIDIA posted $6.05 billion in revenue, but as of January 2024 revenue had jumped to $22.1 billion. That is a whopping 265% improvement and with that growth rate it would not be surprising to see revenues of around $120 billion for the year, up from just $26.9 billion in 2022. Even more astounding is the fact that NVIDIA has a 48.84% net profit margin. There are few companies that have ever achieved growth and profits at this scale. This financial dominance demonstrates the massive potential in the markets NVIDIA competes in and the competitive advantage the company has over other companies.
Investment Thesis: NVIDIA is simply one of the best companies and investments of all time. As we’ve written many times, most of the U.S. stock markets’ historical gains have come from a relatively small group of outstanding companies and NVIDIA is clearly at the top of that list. The company has the best technology, has the scale produce at a level unseen before, is operating in an area of the economy – AI – that didn’t exist all that long ago but is already changing the world and it’s likely we’re still in the beginning stages of the AI revolution. NVIDIA has become one of most highly valued companies in the world, zooming past the valuations of giants like Apple and Amazon along the way and the company is expected to continue growing at a very fast pace.

Overview: As the newest addition to our equity strategies Ely Lilly had to meet our strict guidelines for inclusion into our Blended Equity & U.S. Equity strategies. In current medicine the fastest growing area and most profitable is treating Diabetes and weight loss. Eli Lilly is experiencing great success with their diabetes and weight loss drug Mounjaro, which is quickly becoming a strong competitor to Ozempic and Wegovy, the current leading products in those markets. One of the reasons why Eli Lilly has become so successful is due to their utilization of AI in the drug research and manufacturing process. Lilly signed partnerships with AI firms Verge Genomics and Atomwise in 2021 and 2019, respectively. These collaborations allowed Eli Lilly to launch Zepbound, a weight loss drug, in December 2023, which is expected to become its next blockbuster product. (https://zepbound.lilly.com)
Financial Highlights: Eli Lilly reached $34.12 billion in revenues in 2023, up from $19.6 billion 10 years earlier. The company has seen a surge in revenues since they began utilizing AI in their business. Since 2019 the company has seen growth go from $22.3 billion in revenues to the $34.12 billion mentioned above. Eli Lilly’s profitability also shows that they have a competitive advantage over other drug companies and that the drug discovery platform gives them a powerful business model. Eli Lilly is now invested in the fastest growing and most profitable area of the drug market and the total addressable market from here is truly massive.
Investment Thesis: We invest in the highest quality companies and Eli Lilly checks all our boxes. We expect Lilly’s current net profit margin of 15.4% to grow as revenues increase and will likely be above 20% in the next several years. One of the reasons that the company has been able to achieve that net profit figure is because gross profits are extremely high at 79.25%, demonstrating the organization’s effectiveness and efficiency of operation.
Disclaimer/Disclosure
The purpose of this newsletter is to explain what is happening with our investment strategies and our current views on the markets. We do not sell our investment report and it is intended only as a communication device. The information in this report should not be considered a recommendation to purchase or sell any particular security. There is no assurance or guarantee that the securities discussed herein will remain in an account’s portfolio at the time this report is received. The securities discussed do not represent an account’s entire portfolio and may only represent a small percentage of an account’s portfolio. It should not be assumed that any of the securities discussed were or will prove to be profitable, or that the investment recommendations or decisions ECM makes in the future will be profitable or will equal the investment performance of the securities discussed herein.
ECM uses certain proprietary databases, formulas and devices in its investment decision process. The use of these devices does not change the possibility of loss inherent in all investment decisions.
Contact Us
For questions regarding fees, risks, or other questions, please visit our website at www.ebertcapital.com or contact us directly and we will be happy to assist you.
Ebert Capital Management Inc.
530 F Street
Eureka, CA 95501
Telephone: (707) 407-3813
Toll-free Fax: (855) 407-3815
Email: info@ebertcapital.com

Our Diversified Growth strategy seeks to achieve growth from investing in diversified equity ETFs with exposure to the Nasdaq innovators, the software industry and emerging technologies. The desired holding period is long term. The composite creation date is 01/01/2017. Returns are presented net and gross of actual management fees paid. Fees are described on the last page of this report and apply to all composites managed by Ebert Capital Management Inc. ECM’s account inclusion policy is the first full month or the end of the month in which the account is fully invested. The composite contains both taxable and nontaxable accounts. The returns of the individual portfolios within the composite are time-weighted, use trade date accounting, are based upon monthly portfolio valuations, and include partially backtested data. The composite returns are asset-weighted based upon the beginning period market values calculated in U.S. dollars. The composite contained fewer than 1% of non fee-paying accounts at the end of each year. The performance presented from 01/01/2017 through 12/31/2021 is backtested performance of a model portfolio with the same securities allocations as found in actual client accounts and ECM’s management fee was imputed at the highest level of our fee schedule, 1.5% annually, during this period. The performance results from 01/01/2017 through 12/31/2021 are hypothetical and not based on the performance of actual client accounts. Backtests were performed at portfoliovisualizer.com.

Our Conservative Growth strategy seeks to achieve growth with reduced volatility from investing a mix of equity and fixed income ETFs. The equity ETFs tilt towards sectors with exposure to emerging technologies and the fixed income part of the portfolio focuses on income and low volatility. The desired holding period is long term. The composite creation date is 01/01/2017. Returns are presented net and gross of actual management fees paid. Fees are described on the last page of this report and apply to all composites managed by Ebert Capital Management Inc. ECM’s account inclusion policy is the first full month or the end of the month in which the account is fully invested. The composite contains both taxable and nontaxable accounts. The returns of the individual portfolios within the composite are time-weighted, use trade date accounting, are based upon monthly portfolio valuations, and include partially backtested data. The composite returns are asset-weighted based upon the beginning period market values calculated in U.S. dollars. The composite contained fewer than 1% of non fee-paying accounts at the end of each year. The performance presented from 01/01/2017 through 12/31/2021 is backtested performance of a model portfolio with the same securities allocations as found in actual client accounts and ECM’s management fee was imputed at the highest level of our fee schedule, 1.5% annually, during this period. The performance results from 01/01/2017 through 12/31/2021 are hypothetical and not based on the performance of actual client accounts. Backtests were performed at portfoliovisualizer.com.

Our Blended Equity Strategy is composed of a mix of stocks and ETFs from our other investment strategies. The purpose of this strategy is to hold our firm’s most favored holdings from all our investment strategies. The desired holding period is long term, hopefully perpetually. The strategy is benchmarked to the S&P 500 Index. The composite creation date is 10/01/2019. Returns are presented net and gross of actual management fees paid. Fees are described on the last page of this report and apply to all composites managed by Ebert Capital Management Inc. ECM’s account inclusion policy is the first full month or the end of the month in which the account is fully invested. The composite contains both taxable and nontaxable accounts. The returns of the individual portfolios within the composite are time-weighted, use trade date accounting, are based upon monthly portfolio valuations, and include the reinvestment of all earnings as of the payment date. The composite returns are asset-weighted based upon the beginning period market values calculated in U.S. dollars. The composite contained fewer than 1% of non fee-paying accounts at the end of each year.

Our Global Equity strategy invests in companies with at least 50% of revenues outside the U.S. or significant operations outside the U.S. The desired holding period is long term. This strategy is benchmarked to the S&P 500 Index. The composite creation date is 10/01/2019. Returns are presented net and gross of actual management fees paid. Fees are described on the last page of this report and apply to all composites managed by Ebert Capital Management Inc. ECM’s account inclusion policy is the first full month or the end of the month in which the account is fully invested. The composite contains both taxable and nontaxable accounts. The returns of the individual portfolios within the composite are time-weighted, use trade date accounting, are based upon monthly portfolio valuations, and include the reinvestment of all earnings as of the payment date. The composite returns are asset-weighted based upon the beginning period market values calculated in U.S. dollars. The composite contained fewer than 1% of non fee-paying accounts at the end of each year.

Our U.S. Equity strategy invests in U.S. companies or companies with a majority of operations and revenues coming from the U.S. The desired holding period is long term. This strategy is benchmarked to the S&P 500 Index. The composite creation date is 10/01/2019. Returns are presented net and gross of actual management fees paid. Fees are described on the last page of this report and apply to all composites managed by Ebert Capital Management Inc. ECM’s account inclusion policy is the first full month or the end of the month in which the account is fully invested. The composite contains both taxable and nontaxable accounts. The returns of the individual portfolios within the composite are time-weighted, use trade date accounting, are based upon monthly portfolio valuations, and include the reinvestment of all earnings as of the payment date. The composite returns are asset-weighted based upon the beginning period market values calculated in U.S. dollars. Three-year ex post standard deviation for composite and benchmark is not present if 36 monthly returns are unavailable. A dispersion measure is not shown when there are five or fewer accounts in the composite for the entire year. The internal dispersion is calculated using the asset-weighted standard deviation of annual net returns of those portfolios that were included in the composite. The composite contained fewer than 1% of non fee-paying accounts at the end of each year.

The Conservative Income Strategy consists of all accounts that hold bond ETFs selected with the aim of providing principal protection and income using low-cost bond index ETFs of varying maturity and bond quality and a small allocation to stocks. The strategy is benchmarked to the S&P Global Capital U.S. Aggregate Bond Index. The composite creation date is 8/1/2011. Returns are presented net and gross of actual management fees paid. Fees are described on the last page of this report and apply to all composites managed by Ebert Capital Management Inc. ECM’s account inclusion policy is the first full month or the end of the month in which the account is fully invested. The composite contains both taxable and nontaxable accounts. The returns of the individual portfolios within the composite are time-weighted, use trade date accounting, are based upon monthly portfolio valuations, and include the reinvestment of all earnings as of the payment date. The composite returns are asset-weighted based upon the beginning period market values calculated in U.S. dollars. The Benchmark for the composite is the Barclays Capital U.S. Aggregate Bond Index, presented in U.S. dollars. The composite contained fewer than 1% of non fee-paying accounts at the end of each year.
Ebert Capital Management Inc. (ECM) is an independent, fee-only registered investment adviser. Ebert Capital Management claims compliance with the Global Investment Performance Standards (GIPS®) and has prepared and presented this report in compliance with the GIPS standards. Ebert Capital Management has been independently verified for the periods Dec 1, 2010 through December 31, 2019. The verification report is available upon request. A firm that claims compliance with the GIPS standards must establish policies and procedures for complying with all the applicable requirements of the GIPS standards. Verification provides assurance on whether the firm’s policies and procedures related to composite and pooled fund maintenance, as well as the calculation, presentation, and distribution of performance, have been designed in compliance with the GIPS standards and have been implemented on a firm-wide basis. Verification does not provide assurance on the accuracy of any specific performance report.
GIPS® is a registered trademark of CFA Institute. CFA Institute does not endorse or promote this organization, nor does it warrant the accuracy or quality of the content contained herein. Policies for valuing portfolios, calculating performance, preparing GIPS Reports, and a list of composite descriptions are available upon request.
Past performance does not guarantee future results. Performance data quoted represents past performance. Current performance may be lower or higher than the performance data quoted. Past performance of markets, strategies, composites, or any individual securities is no guarantee of future results. Different types of investments involve varying degrees of risk, and there can be no assurance that any specific investment will either be suitable or profitable for a client’s portfolio. Investment in the above referenced model composite is subject to investment risks, including, without limitation: market risk, interest rate risk, management style risk, business risk, sector risk, and other risks related to equity securities. There are no assurances that a portfolio will match or outperform any particular benchmark. Historical performance results for benchmarks, such as investment indices and/or categories, generally do not reflect the deduction of transaction and/or custodial charges or the deduction of an investment-management fee, which would have the effect of decreasing historical performance results.
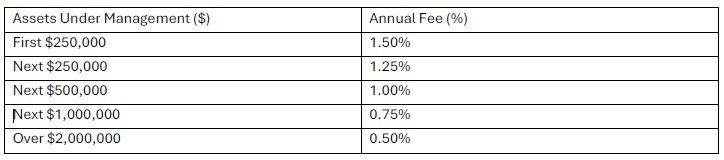
Standard tiered fee scale for all composites.