
January 2024
INVESTMENT OVERVIEW
We are excited to announce that 2023 was a record year for our firm regarding the performance of our investment strategies and growth in the value of assets managed. After one of the worst years for stock and bond markets in 2022, 2023 turned out to be one of the best years for stocks – especially the kind that our firm focuses our largest allocations to – dominant, extremely profitable companies in tech focused industries. For the year, the S&P 500 Index earned a return of 24.23%, the Nasdaq returned 41.08% and the Dow Jones Industrial Average earned a return of 13.78%. By comparison our strategies outperformed the markets by a wide margin in most cases, especially those where we use a blend of individual stocks and ETFs. Our Blended Equity strategy earned a return of 79.78%, our Global Equity strategy earned a return of 73.94%, our U.S. Equity strategy earned a return of 62.96%. Our ETF built investment strategies also saw great returns in 2023, with our Diversified Growth strategy gaining 39.96%, our Conservative Growth strategy gaining 28.99% and our Conservative Income strategy earning a return of 15.93%.
And while 2023 was huge bounce back year for U.S. stocks, the U.S. bond fund market basically made up no ground from what turned out to be the worst bond market crash of the modern era. The Vanguard Total Bond Market Index fund gained 5.60% last year, but the fund is still nearly 20% below its 2020 peak. Foreign stock markets, as they have historically, also drastically underperformed U.S. stocks last year. The iShares All Country World Index fund excluding the U.S. returned just 10%, lagging far behind U.S. markets, and the fund – which represents all foreign markets combined – is still about 15% below its 2020 peak. Source: seekingalpha.com
One year ago, we were writing about the historically poor performance of 2022, which will be looked at as the worst year ever for Large Cap tech stocks, the U.S. bond market, and other types of portfolios such as the 60/40 blended stock and bond portfolio. At this time a year ago, the Federal Reserve was not yet even close to done raising interest rates at the fastest pace in U.S. history, inflation numbers were still at multi-decade high levels and the U.S. economy was fresh off from 2 negative GDP quarters in a row in 2022, which is widely viewed as the definition of a recession. We hadn’t yet reached the banking crisis from March 2023, the Congressional dysfunction that lasted the entire year or the Israeli/Hamas war that started in October. Despite all those challenges, inflation numbers have come down dramatically, the Federal Reserve has not only paused rate hikes but announced rate cuts for 2024 and the U.S. economy has chugged along with strong GDP numbers and an unemployment rate at just 3.7%. Source: tradingeconomics.com
Despite the strong economic figures and stock markets again near all time highs, most Americans aren’t as confident about the U.S. economy because even though inflation has come back down to 3%, prices for most goods and services are still much higher than just a few years ago because of the inflation spike of 2021 and 2022. We hear a refrain from many that “prices haven’t come down” and of course prices don’t come down unless we have “deflation” – it’s just that prices are no longer rising as fast as they did during 2021 and 2022. While the negative views may be warranted, it is certainly good news that the U.S. economy has thus far done well and avoided a technical recession despite much higher interest rates that any point since at least 2007.
Looking back at 2023, why did the U.S. stock market rise so fast? Why did our 3 investment strategies that rely heavily on individual stocks outperform by such a large amount? First, U.S. stock market usually rebounds extremely fast after historically bad years like 2022 certainly was. A year ago, stocks were just plain cheap, so it made sense that if the sky wasn’t really falling, equity prices should rise and they did. But beyond that, the companies that make up huge allocations in our clients’ accounts are doing phenomenally well and are positioned well for the future. Our firm’s largest single stock holding by value, Nvidia, gained nearly 240% in value last year. While some investors might think the stock is now overvalued, its PE ratio (the most commonly used valuation metric) is actually much lower than it was a year ago because the company’s earnings are growing at such an amazing pace. Nvidia is the clear leader in the artificial intelligence surge in our economy, they are many years ahead of any competition in the AI semiconductor industry and we believe we’re still in the beginning stages of the AI-led economy.
Our firm’s other best performing stocks for 2023 include Crowdstrike, which gained a 134% last year; Roku which gained 119% last year; Shopify, which gained 113% last year and several others which gained nearly 100% in the last year including Zscaler, FICO, ServiceNow, Cloudflare and UIPath. 2023 was a transition year for fast growing, tech driven businesses as well. During the extremely low interest rate period of the previous 13 years, it was easy for young tech companies to raise capital and many companies focused exclusively on growth instead of profits. But during times of higher interest rates, when capital is scarce, companies with better profitability, a strong moat from competitors and naturally occurring monopolies tend to do be the best performing stocks and businesses. So, during the 2023 rising interest rate period, the companies with the best business models were able to transition from growth at any cost to producing fantastic profitability. Companies like Roku, Shopify, Amazon, Meta and others cut expenses and cut jobs to dramatically improve the profitability of their businesses. Companies like Crowdstrike, Nvidia, Zscaler, Cloudflare, Microsoft, Apple, Visa, Mastercard and others were able to use their huge market share and pricing power to produce massively improved profits over previous years.
Looking forward, years like 2023 are rare in market history, but so is the strange pandemic and post-pandemic period we lived in from 2020 through 2022. It’s unlikely that we’ll see very many years with comparable gains to 2023, but it also appears that the interest rate shocks of 2022 and 2023, the inflation spike from the pandemic period and many of the challenges related to restarting the economy from a full stop, are in the past. If interest rates come down slightly as the Fed has indicated, but remain at/near historical levels from prior to the Great Recession, we expect the U.S. economy and the U.S. stock market to continue doing well. We expect the kinds of stocks that did well during the long low interest rate period though to be different during this higher interest rate period. We expect companies with durable competitive advantages, monopolies in their industries, high levels of profitability and that are focused on the high growth areas of the economy to do very well in the coming years.
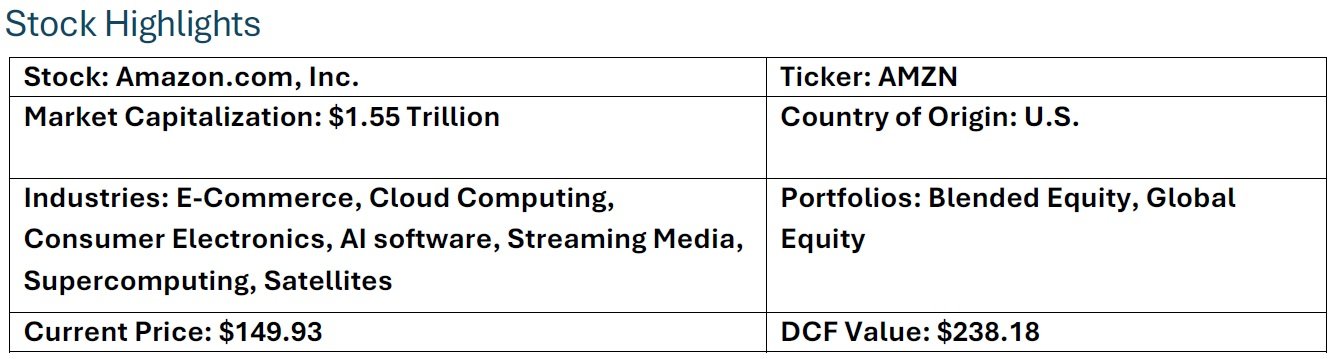
Overview: Amazon.com Inc. is the largest e-commerce and cloud computing company in the world and has many other business lines with high growth and improving profitability. Amazon’s dominance begam in the early 2000’s when the company mainly sold books and music and continued as the company expanded into other products and services. By 2015 Amazon was so successful they became synonymous with putting competitors out of business due to their aggressive approach to become the dominant player in any industry they entered. In fact, just the mention of Amazon entering a new industry would cause the stock prices of their competitors to plummet on the news. Companies now fear competing against Amazon and are forced to change their business strategy when Amazon enters their space, or risk going out of business.
Financial Highlights: Amazon posted $554 billion in sales throughout the trailing 12-month period, up from $280 billion in sales in 2019. Amazon’s market capitalization is over $1.5 trillion, making them one of the biggest companies by market value in the world. Over the last 10 years Amazon’s stock price has risen from $19.80 to $149.42 as of this writing. Experts are predicting that Amazon’s revenues will continue to grow at over 10% per year with earnings expected to grow at an even faster rate, possibly as high as 25%. Source: seekingalpha.com
Investment Thesis: We invest in Amazon because they are a dominant company in every industry they enter. Companies that end up controlling the industry they operate in tend to grow faster and maintain pricing power due to the lack of competition in the industry. We also believe that Amazon is a player in industries with huge potential market size. For example, Amazon Web Services provides cloud computing services to other companies and cloud computing is a very reliable source of revenue and profits with a steady growth rate.

Overview: Fair Isaac Corporation, also known as FICO, invented the credit score. The company provides credit scores to financial institutions and relies on business-to-business sales. FICO derives revenue from subscription charges to its clients to use FICO’s software to run consumer financial analytics. FICO’s clients are banks, loan originators, and other financial institutions that use FICO’s software to determine the creditworthiness of customers and to determine premium prices based on these values.
Financial Highlights: FICO realized $1.513 billion in sales over the last 12 months, up from $1.38 billion in 2022. FICO has a very high 28.3% net profit margin after expenses, which is an indication that it is a very well-run business. Their profit margin has been increasing for years as well, rising from 10.30% in 2015. FICO has been raising prices for its Score subscription model, likely a good reason why their profit margins have gone up. FICO’s dominance in the credit score and analytics business has allowed growing margins and free cash flow, which the company uses to buy back stock annually, causing dramatic increases in earnings per share. Source: seekingalpha.com
Investment Thesis: We like investing in FICO has one of the widest profit margins you will find in a business and the company focuses on making decisions that benefit their shareholders. FICO’s history of buying back shares is very shareholder friendly and gives visibility into future earnings. The consistently dropping share count has caused revenue and earnings per share to rise significantly faster than relying on growth alone. We believe that going forward Wall Street will value companies with share buyback programs at a significant valuation premium. FICO’s naturally occurring monopoly in its business fits exactly the type of business model we find attractive for clients’ portfolios.
Disclaimer/Disclosure
The purpose of this newsletter is to explain what is happening with our investment strategies and our current views on the markets. We do not sell our investment report and it is intended only as a communication device. The information in this report should not be considered a recommendation to purchase or sell any particular security. There is no assurance or guarantee that the securities discussed herein will remain in an account’s portfolio at the time this report is received. The securities discussed do not represent an account’s entire portfolio and may only represent a small percentage of an account’s portfolio. It should not be assumed that any of the securities discussed were or will prove to be profitable, or that the investment recommendations or decisions ECM makes in the future will be profitable or will equal the investment performance of the securities discussed herein.
ECM uses certain proprietary databases, formulas and devices in its investment decision process. The use of these devices does not change the possibility of loss inherent in all investment decisions.
Contact Us
For questions regarding fees, risks, or other questions, please visit our website at www.ebertcapital.com or contact us directly and we will be happy to assist you.
Ebert Capital Management Inc.
530 F Street
Eureka, CA 95501
Telephone: (707) 407-3813
Toll-free Fax: (855) 407-3815
Email: info@ebertcapital.com

Our Diversified Growth strategy seeks to achieve growth from investing in diversified equity ETFs with exposure to the Nasdaq innovators, the software industry and emerging technologies. The desired holding period is long term. The composite creation date is 01/01/2017. Returns are presented net and gross of actual management fees paid. Fees are described on the last page of this report and apply to all composites managed by Ebert Capital Management Inc. ECM’s account inclusion policy is the first full month or the end of the month in which the account is fully invested. The composite contains both taxable and nontaxable accounts. The returns of the individual portfolios within the composite are time-weighted, use trade date accounting, are based upon monthly portfolio valuations, and include partially backtested data. The composite returns are asset-weighted based upon the beginning period market values calculated in U.S. dollars. The composite contained fewer than 1% of non fee-paying accounts at the end of each year. The performance presented from 01/01/2017 through 12/31/2021 is backtested performance of a model portfolio with the same securities allocations as found in actual client accounts and ECM’s management fee was imputed at the highest level of our fee schedule, 1.5% annually, during this period. The performance results from 01/01/2017 through 12/31/2021 are hypothetical and not based on the performance of actual client accounts. Backtests were performed at portfoliovisualizer.com.

Our Conservative Growth strategy seeks to achieve growth with reduced volatility from investing a mix of equity and fixed income ETFs. The equity ETFs tilt towards sectors with exposure to emerging technologies and the fixed income part of the portfolio focuses on income and low volatility. The desired holding period is long term. The composite creation date is 01/01/2017. Returns are presented net and gross of actual management fees paid. Fees are described on the last page of this report and apply to all composites managed by Ebert Capital Management Inc. ECM’s account inclusion policy is the first full month or the end of the month in which the account is fully invested. The composite contains both taxable and nontaxable accounts. The returns of the individual portfolios within the composite are time-weighted, use trade date accounting, are based upon monthly portfolio valuations, and include partially backtested data. The composite returns are asset-weighted based upon the beginning period market values calculated in U.S. dollars. The composite contained fewer than 1% of non fee-paying accounts at the end of each year. The performance presented from 01/01/2017 through 12/31/2021 is backtested performance of a model portfolio with the same securities allocations as found in actual client accounts and ECM’s management fee was imputed at the highest level of our fee schedule, 1.5% annually, during this period. The performance results from 01/01/2017 through 12/31/2021 are hypothetical and not based on the performance of actual client accounts. Backtests were performed at portfoliovisualizer.com.

Our Blended Equity Strategy is composed of a mix of stocks and ETFs from our other investment strategies. The purpose of this strategy is to hold our firm’s most favored holdings from all our investment strategies. The desired holding period is long term, hopefully perpetually. The strategy is benchmarked to the S&P 500 Index. The composite creation date is 10/01/2019. Returns are presented net and gross of actual management fees paid. Fees are described on the last page of this report and apply to all composites managed by Ebert Capital Management Inc. ECM’s account inclusion policy is the first full month or the end of the month in which the account is fully invested. The composite contains both taxable and nontaxable accounts. The returns of the individual portfolios within the composite are time-weighted, use trade date accounting, are based upon monthly portfolio valuations, and include the reinvestment of all earnings as of the payment date. The composite returns are asset-weighted based upon the beginning period market values calculated in U.S. dollars. The composite contained fewer than 1% of non fee-paying accounts at the end of each year.

Our Global Equity strategy invests in companies with at least 50% of revenues outside the U.S. or significant operations outside the U.S. The desired holding period is long term. This strategy is benchmarked to the S&P 500 Index. The composite creation date is 10/01/2019. Returns are presented net and gross of actual management fees paid. Fees are described on the last page of this report and apply to all composites managed by Ebert Capital Management Inc. ECM’s account inclusion policy is the first full month or the end of the month in which the account is fully invested. The composite contains both taxable and nontaxable accounts. The returns of the individual portfolios within the composite are time-weighted, use trade date accounting, are based upon monthly portfolio valuations, and include the reinvestment of all earnings as of the payment date. The composite returns are asset-weighted based upon the beginning period market values calculated in U.S. dollars. The composite contained fewer than 1% of non fee-paying accounts at the end of each year.

Our U.S. Equity strategy invests in U.S. companies or companies with a majority of operations and revenues coming from the U.S. The desired holding period is long term. This strategy is benchmarked to the S&P 500 Index. The composite creation date is 10/01/2019. Returns are presented net and gross of actual management fees paid. Fees are described on the last page of this report and apply to all composites managed by Ebert Capital Management Inc. ECM’s account inclusion policy is the first full month or the end of the month in which the account is fully invested. The composite contains both taxable and nontaxable accounts. The returns of the individual portfolios within the composite are time-weighted, use trade date accounting, are based upon monthly portfolio valuations, and include the reinvestment of all earnings as of the payment date. The composite returns are asset-weighted based upon the beginning period market values calculated in U.S. dollars. Three-year ex post standard deviation for composite and benchmark is not present if 36 monthly returns are unavailable. A dispersion measure is not shown when there are five or fewer accounts in the composite for the entire year. The internal dispersion is calculated using the asset-weighted standard deviation of annual net returns of those portfolios that were included in the composite. The composite contained fewer than 1% of non fee-paying accounts at the end of each year.

The Conservative Income Strategy consists of all accounts that hold bond ETFs selected with the aim of providing principal protection and income using low-cost bond index ETFs of varying maturity and bond quality and a small allocation to stocks. The strategy is benchmarked to the S&P Global Capital U.S. Aggregate Bond Index. The composite creation date is 8/1/2011. Returns are presented net and gross of actual management fees paid. Fees are described on the last page of this report and apply to all composites managed by Ebert Capital Management Inc. ECM’s account inclusion policy is the first full month or the end of the month in which the account is fully invested. The composite contains both taxable and nontaxable accounts. The returns of the individual portfolios within the composite are time-weighted, use trade date accounting, are based upon monthly portfolio valuations, and include the reinvestment of all earnings as of the payment date. The composite returns are asset-weighted based upon the beginning period market values calculated in U.S. dollars. The Benchmark for the composite is the Barclays Capital U.S. Aggregate Bond Index, presented in U.S. dollars. The composite contained fewer than 1% of non fee-paying accounts at the end of each year.
Ebert Capital Management Inc. (ECM) is an independent, fee-only registered investment adviser. Ebert Capital Management claims compliance with the Global Investment Performance Standards (GIPS®) and has prepared and presented this report in compliance with the GIPS standards. Ebert Capital Management has been independently verified for the periods Dec 1, 2010 through December 31, 2019. The verification report is available upon request. A firm that claims compliance with the GIPS standards must establish policies and procedures for complying with all the applicable requirements of the GIPS standards. Verification provides assurance on whether the firm’s policies and procedures related to composite and pooled fund maintenance, as well as the calculation, presentation, and distribution of performance, have been designed in compliance with the GIPS standards and have been implemented on a firm-wide basis. Verification does not provide assurance on the accuracy of any specific performance report.
GIPS® is a registered trademark of CFA Institute. CFA Institute does not endorse or promote this organization, nor does it warrant the accuracy or quality of the content contained herein. Policies for valuing portfolios, calculating performance, preparing GIPS Reports, and a list of composite descriptions are available upon request.
Past performance does not guarantee future results. Performance data quoted represents past performance. Current performance may be lower or higher than the performance data quoted. Past performance of markets, strategies, composites, or any individual securities is no guarantee of future results. Different types of investments involve varying degrees of risk, and there can be no assurance that any specific investment will either be suitable or profitable for a client’s portfolio. Investment in the above referenced model composite is subject to investment risks, including, without limitation: market risk, interest rate risk, management style risk, business risk, sector risk, and other risks related to equity securities. There are no assurances that a portfolio will match or outperform any particular benchmark. Historical performance results for benchmarks, such as investment indices and/or categories, generally do not reflect the deduction of transaction and/or custodial charges or the deduction of an investment-management fee, which would have the effect of decreasing historical performance results.
