
July 2021
Investment Overview
The 2nd quarter market movements in stock and bond indices were far more “normal”, or indicative of patterns seen over the last 10 to 15 years, than the 1st quarter where we saw several historically unique market movements. We wrote about some of the strange activity seen with “meme stocks”, stock sectors such as Retail and Energy that have underperformed for 2 decades suddenly outperforming, and the historically fast spike in bond yields in our last quarterly investment report. Many of these unusual patterns abated or completely reversed during the 2nd quarter. For example, during the 2nd quarter value stocks underperformed the market, while stocks of fast-growing companies became some of the best performing stocks during the 2nd quarter.
One trend that began early in 2021, the meme stock phenomena, to a certain degree sustained its momentum in the 2nd quarter. The meme stock trend was born in online chat forums like Reddit where unrelated groups of investors will buy up stocks of certain companies. Many of the companies seeing these groupthink buying trends are companies that are older, with outdated business models and usually are companies that are struggling to stay in business during the current fast-paced transition to a more digital, tech focused world. The buying trends may seem harmless, but they are having significant real-world effects.
For example, just a few months ago Reddit forum darling AMC Entertainment Holding Inc., notified shareholders that it was in severe danger of going bankrupt. But when the share price spiked from $2 in January this year to a recent high of $61, the company used the higher share price to issue equity (sell new shares) and pay off significant amounts of debt. Now this company that has seen revenues and earnings fall of a cliff in recent years is suddenly in a much better financial position and now even thinking about buying up competitors. Time will tell if the shareholders lose faith and sell, which could cause a cascade of selling and stock price declines.
In our corner of the market, and the real world, where we focus on owning the highest quality companies on the planet, our investment strategies had an excellent 2nd quarter. During the 1st quarter as bond yields were spiking from all-time lows last summer there was a trend we still find baffling where shareholders were selling the stocks of companies growing at very fast rates. Analysts argue that higher rates make high growth companies less attractive from a valuation standpoint because it negatively affects discounted cash flow equations – but that calculus is useless to us because we know that there are a small number of truly exceptional businesses with sustainable growth, and we want to remain invested in those companies regardless of short-term valuation changes. Remaining invested in the “best in class” companies over the long-term is a great way to grow wealth and what bond yields are doing has no impact on these businesses.
Regarding our investment strategies, we are seeing another year of strong growth. Our Global Equity strategy has gained 19.22% year-to-date, Blended Equity 14.18% year-to-date and U.S. Equity 10.64% year-to-date, all returns are net of fees. What’s more impressive to us are the cumulative and annualized returns for each of these green ESG investment strategies, which were launched October 1, 2019. The GIPS® verified returns are listed in more detail on pages 4, 5, and 6 of this report. Our Global Equity strategy is achieving annualized returns of 44.85% vs 23.53% for the All Country World Index over the same period. The Blended Equity strategy is achieving annualized returns of 37.58% vs 23.34% for the S&P 500 Index and 23.53% for the All Country World Index over the same period. And our U.S. Equity strategy is achieving annualized returns of 32.42% vs 23.34% for the S&P 500 Index over the same period. Another impressive element of these investment strategies is that they have had only a slightly higher standard deviation than the overall stock market, despite significant outperformance.
Looking at the markets and the U.S. and global economies from a larger perspective, there still seems to be a lot of good news overall, despite Covid-19 remaining a serious problem for many countries. In the U.S. our vaccination efforts and distribution have been far more successful than even most industrialized nations. Sadly, poorer countries are seeing almost non-existent distribution of high quality Covid-19 vaccines and thus many still have extremely high positivity rates and resulting lockdown measures.
Here is a chart from ourworldindata.org that shows how successful we’ve been versus other global regions in vaccine distribution.

The U.S. had a fully vaccinated rate well above 50% as of June 10th, whereas Europe was just above 40%, South America just above 30% and Asia at about 25% at that same date.
There is also much more political stability and a less acrimonious political atmosphere in the U.S. compared to just a few months ago. The election and subsequent January 6th Capitol Insurrection created an uncertain atmosphere that provided investors and the market plenty of stress and fear of the unknown. With the Biden administration settling in, an air of calm seems to be the pervasive attitude in the stock market, as evidenced by the declining volatility index (VIX). Also, with Congress still as divided as usual it seems less likely that the Biden administration will be able to put forward certain elements of its agenda that the market would dislike, such as large-scale tax increases or policies Republicans would consider anti-capitalist.
Lastly, one element that played a big role in market movements during Q1 was the yield of the 10-year Treasury bond, as previously mentioned. The 10-year yield spiked to a high of about 1.75% on March 31st. While this is still close to all-time lows it was a significant increase from the lows of 2020 because of fears of runaway inflation. The Fed, led by Jerome Powell, has repeatedly stated that this inflation was transitory – meaning much of it is temporary – and it seems for now that he’s been right. The 10-year yield has declined back to 1.32% as of this writing, and many of the inflation measures that scared the market earlier this year have declined significantly. For example, Lumber prices that spiked to nearly $1,700/1,000 board feet have fallen back to $763, a 55% decline in just two months. Many other inflationary indicators that spooked the market have fallen significantly in the last two months as supply and production catch back up with demand now that the economy is opening back up.
STOCK HIGHLIGHTS
Company: Cloudflare Inc.
Industries: Cybersecurity
Portfolio: Blended and Global Equity
Current Price: $108 DCF Value: $107
Company Overview - Cloudflare provides security mitigation services to companies worldwide. Cloudflare protects their customers against Distributed Denial of Service (DDOS) attacks that we have seen recently where hackers disable a company’s operations systems and force them to pay a ransom to get their system back online. The company also offers a Content Delivery Network to host websites and enable online security to those same websites. Cloudflare’s services are sandwiched between the visitor’s network and website host, protecting websites from attacks and enabling the distribution of content.
Financial Highlights - In the last 12 months Cloudflare posted revenues of $478 Million with a growth rate of over 50%. Cloudflare’s recurring revenue model and sticky customer base has enabled consistent high growth and profitability metrics, as evidenced by the nearly 80% gross profit margin. Cloudflare is also flush with cash and has very low debt.
Investment Thesis - We own Cloudflare shares because of the company’s superior business model and because they are a rapidly growing company in an industry that is becoming increasingly important in the digital age. We hope to be long-term investors in a company we feel can grow at a very fast pace for a long time. This company literally checks all the boxes for us including a recurring revenue model, they provide a service customers can’t or won’t cancel, it’s a non-cyclical business in a massive “industry of the future”, and they dominate their area of the cybersecurity industry.
Company: Zscaler, Inc.
Industries: Cybersecurity
Portfolio: Blended Equity, Global Equity
Current Price: $226 DCF Value: $228
Company Overview - Zscaler provides secure access to hosted applications and secure access to external applications. Zscaler enables companies to move their security products to a cloud offering, reducing the need for appliances and reducing costs along the way. Zscaler’s services are cloud-based and are created for a cloud and mobile based world. The company adds a layer of security to protect against attacks that come across content delivery networks (CDN’s). Zscaler provides a cloud firewall that protects companies that offer services through the cloud.
Financial Highlights - Zscaler achieved revenues of $602 million over the past 12 months, up from $54 million in 2015, or 1021% over 6 years. Analysts expect an annual growth rate of over 53% over the short term and an astounding 44% growth rate thereafter. The reason why the company is growing so fast is because of the rapid adoption of Zscaler’s technologies due to the very real necessity for what Zscaler offers. Zscaler has about $1.5 billion in cash, waiting to be deployed in a merger or acquisition, which could potentially boost the revenue growth of the company and help make them more profitable.
Investment Thesis - We believe that cybersecurity related to CDN’s will grow massively in the years to come. Software as a Service (SAAS) has changed the landscape of the internet, and as new technologies emerge, so too does the risk of cyber criminals exploiting these new technologies at the expense of users. Zscaler’s 53% growth rate is reflective of the intense demand for their products. Every day we hear about another cyberattack that holds a company’s data hostage for a ransom, which many companies pay. It is far less expensive to employ technology from Zscaler than it is to pay the ransom to a hacking group. And that is the reality of the world in which we live. Zscaler will continue to grow rapidly and become incrementally more profitable as long as the threat of cybersecurity continues to grow.
Disclaimer/Disclosure
The purpose of this newsletter is to explain what is happening with our investment strategies and our current views on the markets. We do not sell our investment report and it is intended only as a communication device. The information in this report should not be considered a recommendation to purchase or sell any particular security. There is no assurance or guarantee that the securities discussed herein will remain in an account’s portfolio at the time this report is received. The securities discussed do not represent an account’s entire portfolio and may only represent a small percentage of an account’s portfolio. It should not be assumed that any of the securities discussed were or will prove to be profitable, or that the investment recommendations or decisions ECM makes in the future will be profitable or will equal the investment performance of the securities discussed herein.
ECM uses certain proprietary databases, formulas and devices in its investment decision process. The use of these devices does not change the possibility of loss inherent in all investment decisions.
Contact Us
For questions regarding fees, risks, or other questions, please visit our website at www.ebertcapital.com or contact us directly and we will be happy to assist you.
Ebert Capital Management Inc.
530 F Street
Eureka, CA 95501
Telephone: (707) 407-3813
Toll-free Fax: (855) 407-3815
Email: info@ebertcapital.com
Performance

Our U.S. Equity strategy invests in U.S. companies with significant competitive advantages, barriers to entry, preferably a recurring revenue model, and tends to perform well during market selloffs. We only select the most dominant companies in their field. The desired holding period is long term, hopefully perpetually. This strategy consists of U.S. stocks only and is benchmarked to the S&P 500 Index. The U.S. Equity Strategy consists of all accounts that hold U.S. stocks of any market capitalization above $50 million. The composite creation date is 10/01/2019.
Returns are presented net and gross of actual management fees paid. Fees are described on the last page of this report and apply to all composites managed by Ebert Capital Management Inc. ECM’s account inclusion policy is the first full month or the end of the month in which the account is fully invested. The composite contains both taxable and nontaxable accounts. The returns of the individual portfolios within the composite are time-weighted, use trade date accounting, are based upon monthly portfolio valuations, and include the reinvestment of all earnings as of the payment date. The composite returns are asset-weighted based upon the beginning period market values calculated in U.S. dollars. Three-year ex post standard deviation for composite and benchmark is not present if 36 monthly returns are unavailable. A dispersion measure is not shown when there are five or fewer accounts in the composite for the entire year. The internal dispersion is calculated using the asset-weighted standard deviation of annual net returns of those portfolios that were included in the composite. The composite contained fewer than 1% of non-fee paying accounts at the end of each year.
Ebert Capital Management Inc. (ECM) is an independent, fee-only registered investment adviser. Ebert Capital Management claims compliance with the Global Investment Performance Standards (GIPS®) and has prepared and presented this report in compliance with the GIPS standards. Ebert Capital Management has been independently verified for the periods Dec 1, 2010 through December 31, 2013. The verification report is available upon request. A firm that claims compliance with the GIPS standards must establish policies and procedures for complying with all the applicable requirements of the GIPS standards. Verification provides assurance on whether the firm’s policies and procedures related to composite and pooled fund maintenance, as well as the calculation, presentation, and distribution of performance, have been designed in compliance with the GIPS standards and have been implemented on a firm-wide basis. Verification does not provide assurance on the accuracy of any specific performance report. GIPS® is a registered trademark of CFA Institute. CFA Institute does not endorse or promote this organization, nor does it warrant the accuracy or quality of the content contained herein. Policies for valuing portfolios, calculating performance, preparing GIPS Reports, and a list of composite descriptions are available upon request.
Past performance does not guarantee future results. Performance data quoted represents past performance. Current performance may be lower or higher than the performance data quoted. Past performance of markets, strategies, composites, or any individual securities is no guarantee of future results. Different types of investments involve varying degrees of risk, and there can be no assurance that any specific investment will either be suitable or profitable for a client’s portfolio. Investment in the above referenced model composite is subject to investment risks, including, without limitation: market risk, interest rate risk, management style risk, business risk, sector risk, and other risks related to equity securities. There are no assurances that a portfolio will match or outperform any particular benchmark. Historical performance results for benchmarks, such as investment indices and/or categories, generally do not reflect the deduction of transaction and/or custodial charges or the deduction of an investment-management fee, which would have the effect of decreasing historical performance results.
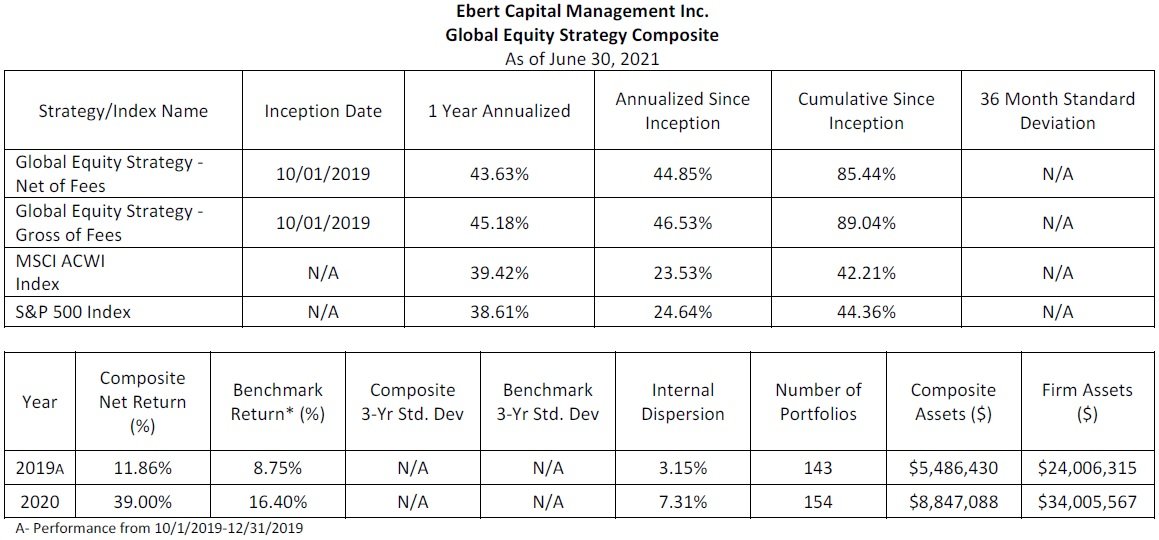
Our Global Equity strategy invests in companies with at least 50% of revenues outside the U.S. or significant operations outside the U.S. The strategy invests in companies with significant competitive advantages, barriers to entry, preferably a recurring revenue model, and tends to perform well during market selloffs. We only select the most dominant companies in their field. The desired holding period is long term, hopefully perpetually. This strategy consists of U.S. Stocks with revenues of 50% or greater coming from outside the U.S. or significant operations outside the U.S. and non-U.S. stocks and is benchmarked to the MSCI ACWI (All Country World) Index. The composite creation date is 10/01/2019.
Returns are presented net and gross of actual management fees paid. Fees are described on the last page of this report and apply to all composites managed by Ebert Capital Management Inc. ECM’s account inclusion policy is the first full month or the end of the month in which the account is fully invested. The composite contains both taxable and nontaxable accounts. The returns of the individual portfolios within the composite are time-weighted, use trade date accounting, are based upon monthly portfolio valuations, and include the reinvestment of all earnings as of the payment date. The composite returns are asset-weighted based upon the beginning period market values calculated in U.S. dollars. The composite contained fewer than 1% of non-fee paying accounts at the end of each year.
Ebert Capital Management Inc. (ECM) is an independent, fee-only registered investment adviser. Ebert Capital Management claims compliance with the Global Investment Performance Standards (GIPS®) and has prepared and presented this report in compliance with the GIPS standards. Ebert Capital Management has been independently verified for the periods Dec 1, 2010 through December 31, 2013. The verification report is available upon request. A firm that claims compliance with the GIPS standards must establish policies and procedures for complying with all the applicable requirements of the GIPS standards. Verification provides assurance on whether the firm’s policies and procedures related to composite and pooled fund maintenance, as well as the calculation, presentation, and distribution of performance, have been designed in compliance with the GIPS standards and have been implemented on a firm-wide basis. Verification does not provide assurance on the accuracy of any specific performance report.
GIPS® is a registered trademark of CFA Institute. CFA Institute does not endorse or promote this organization, nor does it warrant the accuracy or quality of the content contained herein. Policies for valuing portfolios, calculating performance, preparing GIPS Reports, and a list of composite descriptions are available upon request.
Past performance does not guarantee future results. Performance data quoted represents past performance. Current performance may be lower or higher than the performance data quoted. Past performance of markets, strategies, composites, or any individual securities is no guarantee of future results. Different types of investments involve varying degrees of risk, and there can be no assurance that any specific investment will either be suitable or profitable for a client’s portfolio. Investment in the above referenced model composite is subject to investment risks, including, without limitation: market risk, interest rate risk, management style risk, business risk, sector risk, and other risks related to equity securities. There are no assurances that a portfolio will match or outperform any particular benchmark. Historical performance results for benchmarks, such as investment indices and/or categories, generally do not reflect the deduction of transaction and/or custodial charges or the deduction of an investment-management fee, which would have the effect of decreasing historical performance results.

Our Blended Equity Strategy is composed of a mix of our U.S. Equity investments and our Global Equity investments. The purpose of this strategy is to hold stocks of high quality companies that maintain significant competitive advantages over their peers, barriers to entry, preferably with a recurring revenue model, and tends to perform well during market downturns. We only select the most dominant companies in their field. The desired holding period is long term, hopefully perpetually. The strategy is benchmarked to the MSCI ACWI. The composite creation date is 10/01/2019.
Returns are presented net and gross of actual management fees paid. Fees are described on the last page of this report and apply to all composites managed by Ebert Capital Management Inc. ECM’s account inclusion policy is the first full month or the end of the month in which the account is fully invested. The composite contains both taxable and nontaxable accounts. The returns of the individual portfolios within the composite are time-weighted, use trade date accounting, are based upon monthly portfolio valuations, and include the reinvestment of all earnings as of the payment date. The composite returns are asset-weighted based upon the beginning period market values calculated in U.S. dollars. The composite contained fewer than 1% of non-fee paying accounts at the end of each year.
Ebert Capital Management Inc. (ECM) is an independent, fee-only registered investment adviser. Ebert Capital Management claims compliance with the Global Investment Performance Standards (GIPS®) and has prepared and presented this report in compliance with the GIPS standards. Ebert Capital Management has been independently verified for the periods Dec 1, 2010 through December 31, 2013. The verification report is available upon request. A firm that claims compliance with the GIPS standards must establish policies and procedures for complying with all the applicable requirements of the GIPS standards. Verification provides assurance on whether the firm’s policies and procedures related to composite and pooled fund maintenance, as well as the calculation, presentation, and distribution of performance, have been designed in compliance with the GIPS standards and have been implemented on a firm-wide basis. Verification does not provide assurance on the accuracy of any specific performance report.
GIPS® is a registered trademark of CFA Institute. CFA Institute does not endorse or promote this organization, nor does it warrant the accuracy or quality of the content contained herein. Policies for valuing portfolios, calculating performance, preparing GIPS Reports, and a list of composite descriptions are available upon request.
Past performance does not guarantee future results. Performance data quoted represents past performance. Current performance may be lower or higher than the performance data quoted. Past performance of markets, strategies, composites, or any individual securities is no guarantee of future results. Different types of investments involve varying degrees of risk, and there can be no assurance that any specific investment will either be suitable or profitable for a client’s portfolio. Investment in the above referenced model composite is subject to investment risks, including, without limitation: market risk, interest rate risk, management style risk, business risk, sector risk, and other risks related to equity securities. There are no assurances that a portfolio will match or outperform any particular benchmark. Historical performance results for benchmarks, such as investment indices and/or categories, generally do not reflect the deduction of transaction and/or custodial charges or the deduction of an investment-management fee, which would have the effect of decreasing historical performance results.

The Conservative Income Strategy consists of all accounts that hold bond ETFs selected with the aim of providing principal protection and income using low-cost bond index ETFs of varying maturity and bond quality and a small allocation to stocks. The composite creation date is 8/1/2011.
Returns are presented net and gross of actual management fees paid. Fees are described on the last page of this report and apply to all composites managed by Ebert Capital Management Inc. ECM’s account inclusion policy is the first full month or the end of the month in which the account is fully invested. The composite contains both taxable and nontaxable accounts. The returns of the individual portfolios within the composite are time-weighted, use trade date accounting, are based upon monthly portfolio valuations, and include the reinvestment of all earnings as of the payment date. The composite returns are asset-weighted based upon the beginning period market values calculated in U.S. dollars. The Benchmark for the composite is the Barclays Capital U.S. Aggregate Bond Index, presented in U.S. dollars. The composite contained fewer than 1% of non-fee paying accounts at the end of each year.
Ebert Capital Management Inc. (ECM) is an independent, fee-only registered investment adviser. Ebert Capital Management claims compliance with the Global Investment Performance Standards (GIPS®) and has prepared and presented this report in compliance with the GIPS standards. Ebert Capital Management has been independently verified for the periods Dec 1, 2010 through December 31, 2013. The verification report is available upon request. A firm that claims compliance with the GIPS standards must establish policies and procedures for complying with all the applicable requirements of the GIPS standards. Verification provides assurance on whether the firm’s policies and procedures related to composite and pooled fund maintenance, as well as the calculation, presentation, and distribution of performance, have been designed in compliance with the GIPS standards and have been implemented on a firm-wide basis. Verification does not provide assurance on the accuracy of any specific performance report.
GIPS® is a registered trademark of CFA Institute. CFA Institute does not endorse or promote this organization, nor does it warrant the accuracy or quality of the content contained herein. Policies for valuing portfolios, calculating performance, preparing GIPS Reports, and a list of composite descriptions are available upon request.
Past performance does not guarantee future results. Performance data quoted represents past performance. Current performance may be lower or higher than the performance data quoted. Past performance of markets, strategies, composites, or any individual securities is no guarantee of future results. Different types of investments involve varying degrees of risk, and there can be no assurance that any specific investment will either be suitable or profitable for a client’s portfolio. Investment in the above referenced model composite is subject to investment risks, including, without limitation: market risk, interest rate risk, management style risk, business risk, sector risk, and other risks related to equity securities. There are no assurances that a portfolio will match or outperform any particular benchmark. Historical performance results for benchmarks, such as investment indices and/or categories, generally do not reflect the deduction of transaction and/or custodial charges or the deduction of an investment-management fee, which would have the effect of decreasing historical performance results.
