
July 2023
INVESTMENT OVERVIEW
As the calendar flipped from the 1st quarter to the 2nd this year, the focus of U.S. financial markets seemed to change almost overnight from worries about the Federal Reserve’s continued rate hikes, stress in the banking industry, and the debt ceiling fight that threatened the entire economy to a focus on artificial intelligence and a refocus on themes in the tech universe that have been important economic drivers for the last few years. U.S. investors, and markets, have been in a near constant state of worry from 2020 when Covid hit the globe until now…and for good reason. After a roughly 3-year period of historic turbulence in markets and an 18-month period where the Federal Reserve has been hell bent on slowing the economy with a record pace of interest rate hikes, investors became hyper focused on the launch of ChatGPT in March and subsequently all things AI. The Fed has continued their inflation fight with rate hikes except for a pause at the June meeting, but as 2nd quarter earnings reports proved resilient and excitement has grown over AI and its positive effect on corporate profits and growth, investors have temporarily forgotten about the first quarter fears.
This focus on AI has been extremely beneficial for the U.S. stock market and for our investment strategies, but we have to wonder where this focus on AI has been since we began investing in the top AI companies in the world years ago and these companies have been succeeding in their missions and improving their businesses the entire time. AI is not new and many of the largest, most successful corporations have been integrating the technology into their platforms for years.
But after ChatGPT-4 launched in March this year, it quickly gained wide adoption and popularity. This seems to have woken up the general public to the power of artificial intelligence and the speed at which the technology is moving. ChatGPT is owned by a company named OpenAI, which has received massive funding from Microsoft and Microsoft is also implementing ChatGPT throughout its suite of software and services. ChatGPT quickly became the fastest growing consumer software program in history and the market was smitten with all things AI related thereafter. Then, one of our firm’s largest holdings, Nvidia, announced massive growth in revenues and profits in their business largely on the back of their microchips that drive AI and Nvidia stock took off like a rocket. Nvidia and Microsoft, along with many other AI innovators that we’ve been investing in for years including Google, Amazon, Adobe, ServiceNow, Crowdstrike, Snowflake and others, have also benefitted from the new interest in AI. These same stocks took a beating last year despite the businesses themselves humming along, consistently growing revenues, profits and becoming more efficient. But in 2023, the market has decided to adore these stocks – Nvidia especially – and the stock prices are now again beginning to reflect the optimism of the world changing products and services they’re developing, with the help of AI technology.
Aside from AI and its growing influence on the economy, markets still are watching what the Federal Reserve is doing with regard to its historic interest rate hikes. As is well chronicled, rate hikes have a “lagged effect”, meaning that it takes months or potentially a year or more for rate hikes to be reflected in the real economy. Since the Federal Reserve has raised rates over 500 basis points since early 2022, and that was coming off a base of 0%, its still likely that the ultimate impacts of rate hikes are yet to be fully felt. Even though the stock market is performing exceptionally well this year because of earnings resilience, high interest rates will be a challenge for the economy likely for the next few years. The Fed paused rate hikes at their June meeting, but the Fed is now signaling that they are going to continue raising rates throughout the remainder of 2023. Again, these actions by the Fed do not seem rooted in logic, given that the economic data suggests the economy is weakening/slowing and inflation is coming down at an extremely fast pace.
According to tradingeconomics.com, inflation rates of change have roughly been cut in half in the last year. Since we know that interest rate hikes operate with a lagged effect and inflation is already coming down this rapidly, it’s logical to assume that inflation could continue to decline even if the Fed stopped raising rates. We’ve felt the Fed has made mistake after mistake over the years and this trend seems to be continuing still. That leads us to assume that continued volatility could be ahead despite our long-term view that the economy and markets will continue to grow.

With regard to the performance of markets and our strategies this year, we are happy to see significant growth so far. The S&P 500 Index gained 12.23% through June 30th, while the Nasdaq Index gained 30.79% in the first half of the year. Much of this performance can be attributed to the most heavily weighted stocks in the indices, companies such as Apple, Microsoft, Nvidia, Amazon, Google and Tesla. Aside from Tesla, these companies are extremely profitable and highly resilient to economic challenges and thus have been able to withstand high interest rates without suffering stress. These stocks, again aside from Tesla, are also some of our firm’s largest stock holdings along with other stalwarts like Costco, Visa and Adobe. This heavy weighting in the companies we feel are the most dominant businesses with the best business models has helped our equity strategies achieve fantastic year-to-date performance.
Through June 30th our Global Equity strategy is up 51.39%, our Blended Equity strategy has gained 49.81%, our U.S. Equity strategy has gained 34.32%, our Diversified Growth strategy has gained 27.47% and our Conservative Growth strategy has gained 19.40%. All these performance figures are net of fees and you can read our GIPS® compliant performance reports at the end of this quarterly investment report. And despite the bear market in bonds continuing now into its 4th year, our Conservative Income strategy has gained 10.52% and our Municipal strategy has gained 6.43%, net of fees, year to date.
However, despite the strong performance so far this year, given the threat the Fed still represents to the market and the economy we remain cautious. Financial pundits largely agree that a recession is more likely than not in the next year and extreme interest rate hike periods have always been negative for the economy. It’s possible that 2022 represented the worst pain the markets will feel given the historic selloff seen in tech stocks last year, but the uncertainty about the future leads us to focus on the highest quality stocks. Extremely low interest rates, as was the norm for more than 10 years up until last year, incentivize growth, disincentivize profits and the “free capital” can lead to funding of many unproven business models. On the flip side, high interest rates disincentivize funding startups, cause economic weakness and can lead to only the most profitable, durable business models achieving success. Since Silicon Valley Bank failed earlier this year and SVB was the largest lender to startups, the economic environment is going to be clearly less favorable for startup businesses and young companies without profitable business models. This will lead to less innovation and fewer IPOs, but it also means that strong businesses with durable competitive advantages can now operate in an environment where the strongest will grow stronger. It also likely means that many of younger companies we invest in, that went public in the last 5 years, are the last of their kind to go public for quite some time. Leaders in the fields of cybersecurity, database managements and IOT such as Crowdstrike, Snowflake and Datadog are a group companies that dominate their fields and they are unlikely to see privately held competitors go public until interest rates are much lower. This should give these companies a head start that they didn’t need and likely improve their pricing power in the coming years.
This market environment has led us to focus, with regard to individual stocks, on only the highest quality companies and more of a focus on dividend income. In many ways, the current market environment is similar to the period before the Federal Reserve went to 0% interest rates as a response to the 2008 recession. We think this is a good thing. Extremely low interest rates create long-term problems, but so do extremely high interest rates. So, we hope that the Fed will soon stop raising rates and use forward looking data to see that inflation is coming down fast and realize that continuing to raise rates will only cause more economic harm than is necessary to bring inflation down.

Overview: Nvidia provides microchips that are the most utilized and most important chips in the world today. Nvidia’s chips are used in gaming, cryptocurrency, artificial intelligence applications, and many other important areas. The stock is up more than 179% this year, in large part due to the company’s success selling AI chips. The future for Nvidia looks bright and we believe the company will lead tech stocks through the next bull market. Nvidia is an absolute powerhouse in the microchip industry and includes the most powerful gaming GPU on the planet as well as the most popular graphics processor in the U.S. Artificial intelligence has exploded in popularity, led by Nvidia’s breakout quarter.
Financial Highlights: Nvidia’s revenues have grown from $4.13 Billion in 2015 to $25.9 Billion over the last 12 months. One thing that makes Nvidia unique over other tech companies is that they have been profitable since the beginning. In fact, in 2015 they earned $440 million in net income versus $4.80 billion today. The company is expected to grow revenues by 26% year over year, and over 35% free cash flow growth. And despite being one of 4 companies valued at over a trillion dollars, Nvidia is expected to grow at over 30% per year for the next 5 years while maintaining fantastic profitability.
Investment Thesis: We like Nvidia because they are the most dominant company in their space, and it shows up in their financial statements. Nvidia is one of the fastest growing companies in the world and one of the most profitable as well. We also like that they are the industry leader in AI chips, and their sales have increased dramatically as a result. Also, Nvidia hasn’t fueled their growth by issuing new shares, like many tech companies have done for years. Nvidia has durable competitive advantages in several fields including artificial intelligence, which is one of the fastest growing technologies in history.

Overview: Microsoft is another leader in AI. Microsoft fed the craze earlier this year by introducing Chat GPT into its search engine, allowing end users the AI experience. In fact, the response to Microsoft’s collaboration with Open AI was so overwhelmingly positive that other companies, such as Meta, Google, Tesla, and others had to fast track their AI plans and get them to market ASAP. The impact that Microsoft has had on their competitors has created an AI arms race, where all companies are trying to get a product to market as quickly as they can. The company already is a very strong competitor in Cloud Storage & Computing, IOT, gaming, and now the category of AI.
Financial Highlights: Microsoft has achieved $207.60 billion in annual sales, up from $77.80 billion 10 years ago. The company is growing rapidly and is very profitable with a current growth rate of 19% and net income ratio of 33.4%. Microsoft also pays $2.72 of their annual earnings back to their shareholders as dividends, and this figure is growing along with the company. Microsoft’s recurring revenue model and the fact that its products and services are necessary for so many businesses and governments to operate, insulates the company from economic turbulence. The numbers make it clear, this company has durable competitive advantages in most of the businesses it operates in and will likely remain one of the highest quality companies in the world for the foreseeable future.
Investment Thesis: We love investing in high growth, high profitability companies and Microsoft fits the bill perfectly. Microsoft is a rapidly growing technology company with both legacy products and new product categories. Microsoft is one of our favorite companies to invest in due to their rapid growth, high profitability, and stable stock price. With a market capitalization of $2.51 trillion, it is one of the largest publicly traded companies in the world.
Disclaimer/Disclosure
The purpose of this newsletter is to explain what is happening with our investment strategies and our current views on the markets. We do not sell our investment report and it is intended only as a communication device. The information in this report should not be considered a recommendation to purchase or sell any particular security. There is no assurance or guarantee that the securities discussed herein will remain in an account’s portfolio at the time this report is received. The securities discussed do not represent an account’s entire portfolio and may only represent a small percentage of an account’s portfolio. It should not be assumed that any of the securities discussed were or will prove to be profitable, or that the investment recommendations or decisions ECM makes in the future will be profitable or will equal the investment performance of the securities discussed herein.
ECM uses certain proprietary databases, formulas and devices in its investment decision process. The use of these devices does not change the possibility of loss inherent in all investment decisions.
Contact Us
For questions regarding fees, risks, or other questions, please visit our website at www.ebertcapital.com or contact us directly and we will be happy to assist you.
Ebert Capital Management Inc.
530 F Street
Eureka, CA 95501
Telephone: (707) 407-3813
Toll-free Fax: (855) 407-3815
Email: info@ebertcapital.com

Our Diversified Growth strategy seeks to achieve growth from investing in diversified equity ETFs with exposure to the Nasdaq innovators, the software industry and emerging technologies. The desired holding period is long term. The composite creation date is 01/01/2017. Returns are presented net and gross of actual management fees paid. Fees are described on the last page of this report and apply to all composites managed by Ebert Capital Management Inc. ECM’s account inclusion policy is the first full month or the end of the month in which the account is fully invested. The composite contains both taxable and nontaxable accounts. The returns of the individual portfolios within the composite are time-weighted, use trade date accounting, are based upon monthly portfolio valuations, and include partially backtested data. The composite returns are asset-weighted based upon the beginning period market values calculated in U.S. dollars. The composite contained fewer than 1% of non fee-paying accounts at the end of each year. The performance presented from 01/01/2017 through 12/31/2021 is backtested performance of a model portfolio with the same securities allocations as found in actual client accounts and ECM’s management fee was imputed at the highest level of our fee schedule, 1.5% annually, during this period. The performance results from 01/01/2017 through 12/31/2021 are hypothetical and not based on the performance of actual client accounts. Backtests were performed at portfoliovisualizer.com.

Our Conservative Growth strategy seeks to achieve growth with reduced volatility from investing a mix of equity and fixed income ETFs. The equity ETFs tilt towards sectors with exposure to emerging technologies and the fixed income part of the portfolio focuses on income and low volatility. The desired holding period is long term. The composite creation date is 01/01/2017. Returns are presented net and gross of actual management fees paid. Fees are described on the last page of this report and apply to all composites managed by Ebert Capital Management Inc. ECM’s account inclusion policy is the first full month or the end of the month in which the account is fully invested. The composite contains both taxable and nontaxable accounts. The returns of the individual portfolios within the composite are time-weighted, use trade date accounting, are based upon monthly portfolio valuations, and include partially backtested data. The composite returns are asset-weighted based upon the beginning period market values calculated in U.S. dollars. The composite contained fewer than 1% of non fee-paying accounts at the end of each year. The performance presented from 01/01/2017 through 12/31/2021 is backtested performance of a model portfolio with the same securities allocations as found in actual client accounts and ECM’s management fee was imputed at the highest level of our fee schedule, 1.5% annually, during this period. The performance results from 01/01/2017 through 12/31/2021 are hypothetical and not based on the performance of actual client accounts. Backtests were performed at portfoliovisualizer.com.

Our Global Equity strategy invests in companies with at least 50% of revenues outside the U.S. or significant operations outside the U.S. The desired holding period is long term. This strategy is benchmarked to the S&P 500 Index. The composite creation date is 10/01/2019. Returns are presented net and gross of actual management fees paid. Fees are described on the last page of this report and apply to all composites managed by Ebert Capital Management Inc. ECM’s account inclusion policy is the first full month or the end of the month in which the account is fully invested. The composite contains both taxable and nontaxable accounts. The returns of the individual portfolios within the composite are time-weighted, use trade date accounting, are based upon monthly portfolio valuations, and include the reinvestment of all earnings as of the payment date. The composite returns are asset-weighted based upon the beginning period market values calculated in U.S. dollars. The composite contained fewer than 1% of non fee-paying accounts at the end of each year.

Our U.S. Equity strategy invests in U.S. companies or companies with most a majority of operations and revenues coming from the U.S. The desired holding period is long term. This strategy is benchmarked to the S&P 500 Index. The composite creation date is 10/01/2019. Returns are presented net and gross of actual management fees paid. Fees are described on the last page of this report and apply to all composites managed by Ebert Capital Management Inc. ECM’s account inclusion policy is the first full month or the end of the month in which the account is fully invested. The composite contains both taxable and nontaxable accounts. The returns of the individual portfolios within the composite are time-weighted, use trade date accounting, are based upon monthly portfolio valuations, and include the reinvestment of all earnings as of the payment date. The composite returns are asset-weighted based upon the beginning period market values calculated in U.S. dollars. Three-year ex post standard deviation for composite and benchmark is not present if 36 monthly returns are unavailable. A dispersion measure is not shown when there are five or fewer accounts in the composite for the entire year. The internal dispersion is calculated using the asset-weighted standard deviation of annual net returns of those portfolios that were included in the composite. The composite contained fewer than 1% of non fee-paying accounts at the end of each year.

Our Blended Equity Strategy is composed of a mix of stocks and ETFs from our other investment strategies. The purpose of this strategy is to hold our firm’s most favored holdings from all our investment strategies. The desired holding period is long term, hopefully perpetually. The strategy is benchmarked to the S&P 500 Index. The composite creation date is 10/01/2019. Returns are presented net and gross of actual management fees paid. Fees are described on the last page of this report and apply to all composites managed by Ebert Capital Management Inc. ECM’s account inclusion policy is the first full month or the end of the month in which the account is fully invested. The composite contains both taxable and nontaxable accounts. The returns of the individual portfolios within the composite are time-weighted, use trade date accounting, are based upon monthly portfolio valuations, and include the reinvestment of all earnings as of the payment date. The composite returns are asset-weighted based upon the beginning period market values calculated in U.S. dollars. The composite contained fewer than 1% of non fee-paying accounts at the end of each year.
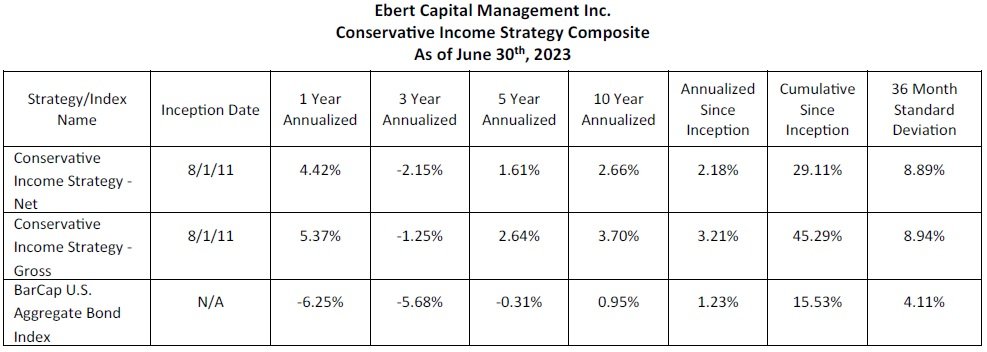
The Conservative Income Strategy consists of all accounts that hold bond ETFs selected with the aim of providing principal protection and income using low-cost bond index ETFs of varying maturity and bond quality and a small allocation to stocks. The strategy is benchmarked to the Barclays Capital U.S. Aggregate Bond Index. The composite creation date is 8/1/2011. Returns are presented net and gross of actual management fees paid. Fees are described on the last page of this report and apply to all composites managed by Ebert Capital Management Inc. ECM’s account inclusion policy is the first full month or the end of the month in which the account is fully invested. The composite contains both taxable and nontaxable accounts. The returns of the individual portfolios within the composite are time-weighted, use trade date accounting, are based upon monthly portfolio valuations, and include the reinvestment of all earnings as of the payment date. The composite returns are asset-weighted based upon the beginning period market values calculated in U.S. dollars. The Benchmark for the composite is the Barclays Capital U.S. Aggregate Bond Index, presented in U.S. dollars. The composite contained fewer than 1% of non fee-paying accounts at the end of each year.
Ebert Capital Management Inc. (ECM) is an independent, fee-only registered investment adviser. Ebert Capital Management claims compliance with the Global Investment Performance Standards (GIPS®) and has prepared and presented this report in compliance with the GIPS standards. Ebert Capital Management has been independently verified for the periods Dec 1, 2010 through December 31, 2019. The verification report is available upon request. A firm that claims compliance with the GIPS standards must establish policies and procedures for complying with all the applicable requirements of the GIPS standards. Verification provides assurance on whether the firm’s policies and procedures related to composite and pooled fund maintenance, as well as the calculation, presentation, and distribution of performance, have been designed in compliance with the GIPS standards and have been implemented on a firm-wide basis. Verification does not provide assurance on the accuracy of any specific performance report.
GIPS® is a registered trademark of CFA Institute. CFA Institute does not endorse or promote this organization, nor does it warrant the accuracy or quality of the content contained herein. Policies for valuing portfolios, calculating performance, preparing GIPS Reports, and a list of composite descriptions are available upon request.
Past performance does not guarantee future results. Performance data quoted represents past performance. Current performance may be lower or higher than the performance data quoted. Past performance of markets, strategies, composites, or any individual securities is no guarantee of future results. Different types of investments involve varying degrees of risk, and there can be no assurance that any specific investment will either be suitable or profitable for a client’s portfolio. Investment in the above referenced model composite is subject to investment risks, including, without limitation: market risk, interest rate risk, management style risk, business risk, sector risk, and other risks related to equity securities. There are no assurances that a portfolio will match or outperform any particular benchmark. Historical performance results for benchmarks, such as investment indices and/or categories, generally do not reflect the deduction of transaction and/or custodial charges or the deduction of an investment-management fee, which would have the effect of decreasing historical performance results.
