
October 2022
INVESTMENT OVERVIEW
The Federal Reserve’s interest rate hiking campaign continued its record pace in the 3rd quarter, causing the historic and dramatic 2022 declines in stocks, bonds and most asset classes to get worse. Stock and bond markets have suffered greatly since the Fall of 2021 for a variety of reasons, but most agree the declines have 3 mains sources: 1) The Federal Reserve hiking interest rates at the fastest pace in U.S. history, allowing a recession because they say higher unemployment and a declining economy will slow inflation; 2) Vladimir Putin’s war in Ukraine has caused death and destruction, an energy crisis and a huge recession in Europe and 3) China’s zero covid policy after 2+ years has caused supply chain issues and a Chinese growth slowdown. Many economists now pin the blame for much the inflation problem on the Federal Reserve and Biden Administration for overstimulating the economy during the pandemic and keeping interest rates at zero for too long when it was clear the economy was improving and inflation was becoming a serious problem. It seems that the Federal Reserve, embarrassed by making such enormous mistakes in 2020 and 2021, is overreacting by raising interest rates nearly 400 basis points in just 7 months.
The Federal Reserve, led by Jerome Powell, states that their mandate is price stability and low unemployment. Clearly they have failed in keeping prices stable and they were extremely slow to recognize that their actions caused inflation to spiral. Inflation does not increase immediately from fiscal policy due to a lagging effect and inflation will not decline immediately from the Fed’s interest rate hikes. Indeed, the Fed overstimulated by printing too much money, engaged in record breaking quantitative easing and kept rates at zero too long – but inflation didn’t become a problem until about 18 months after taking these actions. Now, the Fed continues to raise interest rates at extreme levels and openly admit they want markets to decline, wages to stop growing and unemployment to increase because they say this will cause inflation to slow down. First of all, it is scary to think that its official Fed policy to see economic harm done to the American people to correct for their mistakes. Secondly though, the Fed seems not to recognize that jacking up rates this fast won’t bring inflation down immediately, just as it didn’t become a problem immediately after their stimulative actions.
When the Federal Reserve is raising interest rates at this speed, it creates a multitude of problems for nearly every economy in the world. When interest rates rise very quickly, it causes a freezing effect in the parts of the economy that rely on available and affordable credit. For example, borrowing costs for financing everything from homes to cars is coming to a screeching halt. Fast interest rate increases also causes the dollar to strengthen versus foreign currencies because the U.S. dollar is still the world’s reserve currency. Because trillions of dollars of foreign debt, especially among emerging market economies, is denominated in U.S. dollars, a strengthening dollar causes emerging market debt to balloon. This explosion in debt and debt servicing costs is coming at a time when the interest rates hikes are causing a global recession and a slowdown in growth for emerging economies. So poorer countries are seeing their economies slow at exactly the same time their debt load is growing. This is a recipe for disaster for many countries with poor credit quality and a need to access global debt markets.
The interest rate increases also cause problems for U.S. multinational companies with significant revenues coming from outside the U.S. Because multinationals must convert their foreign currency sales back into U.S. dollars to “bring their money home”, these companies are seeing revenue declines exclusively due to these currency exchange problems. Like countries, companies that rely on debt financing are faced with a double whammy of slowing sales and increased debt financing costs. Now interest rates are nowhere near past historic levels, to be sure. But because the U.S. has had extremely low interest rates for about 15 years, most companies and countries have developed their economic models around a low interest rate environment. Raising interest rates to historical norms is not a problem and “cheap money” causes problems of its own. But the biggest problem is not only how fast the Fed is asking companies and countries to adapt to these higher rates, but also because just 6 months ago the Federal Reserve was still saying that interest rates would remain low.
Suddenly though, during the early summer, Jerome Powell decided to shock the world. Despite saying the inflation was transitory for most of 2021 and saying that he would keep the Federal Funds rates below 2% for some time, he and other Federal Reserve leaders suddenly began doing TV interviews weekly stating that interest rates would have to rise much faster. This gave the market and the economy no time to adapt and very quickly these interest rate increases started to cause shocks in a variety of markets and countries that had remained stable for a long time. In fact, each time the stock or bond markets would rally for a few days, the Federal Reserve leaders would quickly do television appearances to “talk down the markets”. Never before have Americans heard the Federal Reserve state they wanted markets to decline, businesses and employees to suffer and unemployment to rise. The reverberations of their 2022 actions are still unfolding, but its become increasingly clear that the Fed is a big risk to the global economy along with China and Russia. The Fed lost credibility with their previous mistakes and there’s a sense their credibility has only gotten worse this year.
The last few weeks, cracks in the global financial system have begun to appear. For example, the United Kingdom’s pension system nearly failed, in part because the Fed rate hikes caused a spike in the U.S. dollar and indirectly led to large losses in the U.K. pension system’s debt holdings. The Fed’s rate hikes have caused a spike in the yields of U.S. Treasury bonds, which has led to “capital flight” in other countries. This is because U.S. Treasury bonds are viewed as the highest quality debt investments, so when U.S. yields rise, bondholders holding lower quality, lower yielding debt sell their foreign bond holdings to buy treasuries. This “capital flight selling” causes significant problems for many foreign countries, so these countries also raise rates so that their bonds are competitive with U.S. treasuries. This has led to a nearly coordinated interest raising cycle worldwide, further damaging the global economy and further stunting global growth.
If the Federal Reserve continues raising rates at this record pace, many economists agree that something is going to “break”. So a prevailing opinion has begun to emerge that the Federal Reserve is going to have to stop pause their rate hikes soon to avoid serious “black swan” events that could cause permanent harm to the global financial system. Although the Fed may have to keep rates high in order to slow demand and therefore cause prices of goods to decline, a pause or slowdown in rate hikes will likely stabilize the global economy and cause a huge rebound in U.S. stock and bond markets.
Because the stock market is a forward looking indicator, we don’t need the economy or inflation to improve to start a market rebound. The market simply needs a sign that the Fed might pause or that some of the other ills the world is facing, such as those in Ukraine or China, might get better. Markets nearly always rebound well before the worst news is being reported. And markets have nearly always significantly rebounded by the time the U.S. government even announces that we’re in a recession. The “great recession” for example caused long-term economic problems that lasted for several years after the market bottomed in 2009. But again, because the stock market is a forward looking indicator, U.S. stocks bottomed on March 10th, 2009 and began a dramatic rebound that predated any real economy recovery. The graph below from Yahoo Finance shows how rapidly the stock market rebounded despite economic conditions remaining weak for several more years.

Source: Yahoo Finance
The pink line above represents the internet sector ETF (FDN), the blue represents the Nasdaq Index (QQQ), the yellow line represents the software index (IGV) and light blue and purple lines represent the S&P 500 Index and Dow Jones Industrial Average, respectively. This historical example shows that not only do markets recover long before the economy does, but that much of the recovery often happens in just the first months after a market bottom. In fact for some of the best performing sectors of the market, like the internet sector and the Nasdaq index, more than 1/3 of the gains those sectors had between March 10th 2009 and January 1st 2015, happened in just those first 10 months from the 2009 bottom. So we are confident that the market will rebound and given the historic declines, it could happen very quickly…for stocks.
The Fed’s mission has also been extremely unkind to bond markets and we feel that it will likely take much longer for the bond market to recover to previous highs than stocks. Although bonds now offer much higher yields that at any point since about 2006, because long-term bonds have lost about 20 years of gains since mid 2020, it would take very high returns to get back to the 2020 bond market highs in the next 5 to 7 years. The graph below shows just how detrimental raising rates this fast has been for bond markets. Below you’ll see the performance of the Vanguard Long Term Bond Fund (ticker BLV), one of the largest and highest quality bond funds in the world, from its inception in April 2007 to October 14th this year. As you can see the bond market crash has taken all the gains the fund accumulated from inception and the fund is now selling for a lower price than when it was launched. Other, older long-term bond funds are showing more than 20 years of gains have been erased since the bond market peaked in late July of 2020. Using some basic math, the BLV fund would need to average returns of about 11% per year to get back to its previous high in 5 years. Given that bond market returns since the Great Depression have averaged about 5%, bond investors will need to be patient.

Source: Yahoo Finance
STOCK HIGHLIGHTS
Company: Visa Inc.
Ticker: V
Market Capitalization: $380.598 Billion
Country of Origin: USA
Industries: Financial Services
Portfolios: Conservative Income, Global Equity, Muni
Current Price: $180.52
DCF Value: $217.39
Source: Seeking Alpha
Overview: Visa Inc. is one of the most well-known companies on the planet. Visa currently is a major sponsor and official partner of The Olympics, FIFA World Cup, The NFL, individual athletes such as alpine skier Mikaela Shiffrin, and many others. Visa is extremely consistent with its revenue growth rate and its profitability. In fact, over the last 10 years Visa has had only one year of negative revenue growth, caused by the Covid-19 Pandemic, but has since returned to consistent growth. Visa has consistently been one of the safest investments in a high growth stock, and the reason is because Visa has a major competitive advantage over its peers because they don’t extend credit to their customers, and instead rely on generating fees produced through debit and credit transactions.
Financial Highlights: Visa produces their revenue through their digital payments platform. Visa produced $28.082 billion in revenue over the most recent trailing twelve months, up from $24.105 billion for the 2021 fiscal year ended September 30, 2021. Visa produced a profit of $14.601 billion, for a net profit margin of 52%, which is extremely high and about as high as a net margin goes. The growth rates and profitability are evidence that Visa’s competitive advantage is sustainable and growing. In addition to its stock price appreciation, Visa also pays a dividend of $1.50 per share, which is good for a yield of 0.83%. Visa’s long term growth rate is expected to remain high at 14%.
Investment Thesis: Visa is one of the main leaders in digital payments and their proprietary transaction network processes payments for over 15,100 financial institutions, leading to over 232 billion transactions annually. We invested in Visa because they have a sustainable competitive advantage over their peers and will continue to have that advantage for the foreseeable future. Visa doesn’t expose the business to extending credit to customers, which can be risky during troubled economic times. And because they derive revenue from their digital payments platform, they have benefited from the move to a cashless society.
Company: Costco Wholesale Corporation
Ticker: COST
Market Capitalization: $380.546 Billion
Country of Origin: USA
Industries: Discount Retailer
Portfolios: Conservative Income, Muni
Current Price: $480.67
DCF Value: $663.28
Source: Seeking Alpha
Overview: Costco is the leading discount retailer in the United States. Costco currently has 815 stores worldwide, including 564 in the United States & Puerto Rico. People shop at Costco for many reasons, including saving money, buying in large quantities, selection of high-quality grocery and non-grocery items, and dedication to certain products Costco offers. Costco is one of the most well-known discount retailers, and their brand is recognized immediately by consumers. Their customers are attracted to top quality national brands as well as the private label products also offered at their stores. Costco has been successful at recruiting new customers for many decades, and their dedication to providing a great customer experience is reflected by their growth over the years.
Financial Highlights: Over the last 10 years Costco has increased revenue from $105.16 billion in 2013 to $226.95 billion as of August 2022, or 116%. Costco currently has total assets of $64.17 billion, up from $30.28 billion in 2013. These results are evident of the high growth rate that Costco achieves by delivering to their customers exactly what they want. Costco is also a very safe stock to invest in, compared with its peers. Over the past 10 years the stock price has climbed from $106 in 2013 to $479.22 in October 2022. The stock is also insulated from negative economic trends and is much less volatile than its competitors. During the 2008-2009 recession Costco stock lost 46% from top to bottom, however the S&P 500 suffered a 56% loss from top to bottom. During the period from the bottom in 2009 until the top in 2021, the S&P 500 gained 597%, however Costco significantly outperformed that with a 1446% return through the same period. While it remains to be seen how Costco’s performance will compare in today’s stock market selloff, so far this year the stock is outperforming the S&P 500.
Investment Thesis: We’ve been investing client funds in Costco for years because we believe that the company offers lots of upside potential, while limiting the downside potential of the stock, due to its competitive advantage over its peers and due to the cult like following of its customers. We believe that Costco’s business model is superior to their competitors and the company is managed better than the majority of companies in the U.S. Because Costco sells discount retail items, they have built in economic advantage during tough economic times as customers shop more at Costco during recessions, due to the discounts. The inflationary environment might provide Costco another advantage. Generally, inflation is not good for retailers, however Costco has improved its store significantly over the years and other competitors may begin to lose steam or even go bankrupt, leaving Costco an opportunity to expand into its competitors’ markets. Overall, we believe that Costco is a bellwether company and will do both in good times and bad.
Disclaimer/Disclosure
The purpose of this newsletter is to explain what is happening with our investment strategies and our current views on the markets. We do not sell our investment report and it is intended only as a communication device. The information in this report should not be considered a recommendation to purchase or sell any particular security. There is no assurance or guarantee that the securities discussed herein will remain in an account’s portfolio at the time this report is received. The securities discussed do not represent an account’s entire portfolio and may only represent a small percentage of an account’s portfolio. It should not be assumed that any of the securities discussed were or will prove to be profitable, or that the investment recommendations or decisions ECM makes in the future will be profitable or will equal the investment performance of the securities discussed herein.
ECM uses certain proprietary databases, formulas and devices in its investment decision process. The use of these devices does not change the possibility of loss inherent in all investment decisions.
Contact Us
For questions regarding fees, risks, or other questions, please visit our website at www.ebertcapital.com or contact us directly and we will be happy to assist you.
Ebert Capital Management Inc.
530 F Street
Eureka, CA 95501
Telephone: (707) 407-3813
Toll-free Fax: (855) 407-3815
Email: info@ebertcapital.com

Our Diversified Growth strategy seeks to achieve growth from investing in diversified equity ETFs with exposure to the Nasdaq innovators, the software industry and emerging technologies. The desired holding period is long term. The composite creation date is 01/01/2017. Returns are presented net and gross of actual management fees paid. Fees are described on the last page of this report and apply to all composites managed by Ebert Capital Management Inc. ECM’s account inclusion policy is the first full month or the end of the month in which the account is fully invested. The composite contains both taxable and nontaxable accounts. The returns of the individual portfolios within the composite are time-weighted, use trade date accounting, are based upon monthly portfolio valuations, and include partially backtested data. The composite returns are asset-weighted based upon the beginning period market values calculated in U.S. dollars. The composite contained fewer than 1% of non fee-paying accounts at the end of each year. The performance presented from 01/01/2017 is backtested performance of a model portfolio with the same securities allocations as found in actual client accounts. ECM’s management fee was imputed at the highest level of our fee schedule, 1.5% annually. The performance results from 01/01/2017 through 12/31/2021 are hypothetical and not based on the performance of actual client accounts. Backtests were performed at portfoliovisualizer.com.

Our Conservative Growth strategy seeks to achieve growth with reduced volatility from investing a mix of equity and fixed income ETFs. The equity ETFs tilt towards sectors with exposure to emerging technologies and the fixed income part of the portfolio focuses on income and low volatility. The desired holding period is long term. The composite creation date is 01/01/2017. Returns are presented net and gross of actual management fees paid. Fees are described on the last page of this report and apply to all composites managed by Ebert Capital Management Inc. ECM’s account inclusion policy is the first full month or the end of the month in which the account is fully invested. The composite contains both taxable and nontaxable accounts. The returns of the individual portfolios within the composite are time-weighted, use trade date accounting, are based upon monthly portfolio valuations, and include partially backtested data. The composite returns are asset-weighted based upon the beginning period market values calculated in U.S. dollars. The composite contained fewer than 1% of non fee-paying accounts at the end of each year. The performance presented from 01/01/2017 is backtested performance of a model portfolio with the same securities allocations as found in actual client accounts. ECM’s management fee was imputed at the highest level of our fee schedule, 1.5% annually. The performance results from 01/01/2017 through 12/31/2021 are hypothetical and not based on the performance of actual client accounts. Backtests were performed at portfoliovisualizer.com.
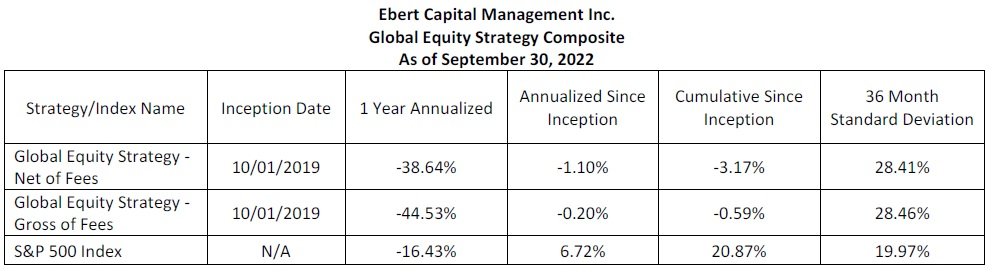
Our Global Equity strategy invests in companies with at least 50% of revenues outside the U.S. or significant operations outside the U.S. The desired holding period is long term. This strategy is benchmarked to the S&P 500 Index. The composite creation date is 10/01/2019. Returns are presented net and gross of actual management fees paid. Fees are described on the last page of this report and apply to all composites managed by Ebert Capital Management Inc. ECM’s account inclusion policy is the first full month or the end of the month in which the account is fully invested. The composite contains both taxable and nontaxable accounts. The returns of the individual portfolios within the composite are time-weighted, use trade date accounting, are based upon monthly portfolio valuations, and include the reinvestment of all earnings as of the payment date. The composite returns are asset-weighted based upon the beginning period market values calculated in U.S. dollars. The composite contained fewer than 1% of non fee-paying accounts at the end of each year.

Our U.S. Equity strategy invests in U.S. companies or companies with most a majority of operations and revenues coming from the U.S. The desired holding period is long term. This strategy is benchmarked to the S&P 500 Index. The composite creation date is 10/01/2019. Returns are presented net and gross of actual management fees paid. Fees are described on the last page of this report and apply to all composites managed by Ebert Capital Management Inc. ECM’s account inclusion policy is the first full month or the end of the month in which the account is fully invested. The composite contains both taxable and nontaxable accounts. The returns of the individual portfolios within the composite are time-weighted, use trade date accounting, are based upon monthly portfolio valuations, and include the reinvestment of all earnings as of the payment date. The composite returns are asset-weighted based upon the beginning period market values calculated in U.S. dollars. Three-year ex post standard deviation for composite and benchmark is not present if 36 monthly returns are unavailable. A dispersion measure is not shown when there are five or fewer accounts in the composite for the entire year. The internal dispersion is calculated using the asset-weighted standard deviation of annual net returns of those portfolios that were included in the composite. The composite contained fewer than 1% of non fee-paying accounts at the end of each year.

Our Blended Equity Strategy is composed of a mix of stocks and ETFs from our other investment strategies. The purpose of this strategy is to hold our firm’s most favored holdings from all our investment strategies. The desired holding period is long term, hopefully perpetually. The strategy is benchmarked to the S&P 500 Index. The composite creation date is 10/01/2019. Returns are presented net and gross of actual management fees paid. Fees are described on the last page of this report and apply to all composites managed by Ebert Capital Management Inc. ECM’s account inclusion policy is the first full month or the end of the month in which the account is fully invested. The composite contains both taxable and nontaxable accounts. The returns of the individual portfolios within the composite are time-weighted, use trade date accounting, are based upon monthly portfolio valuations, and include the reinvestment of all earnings as of the payment date. The composite returns are asset-weighted based upon the beginning period market values calculated in U.S. dollars. The composite contained fewer than 1% of non fee-paying accounts at the end of each year.

The Conservative Income Strategy consists of all accounts that hold bond ETFs selected with the aim of providing principal protection and income using low-cost bond index ETFs of varying maturity and bond quality and a small allocation to stocks. The strategy is benchmarked to the Barclays Capital U.S. Aggregate Bond Index. The composite creation date is 8/1/2011. Returns are presented net and gross of actual management fees paid. Fees are described on the last page of this report and apply to all composites managed by Ebert Capital Management Inc. ECM’s account inclusion policy is the first full month or the end of the month in which the account is fully invested. The composite contains both taxable and nontaxable accounts. The returns of the individual portfolios within the composite are time-weighted, use trade date accounting, are based upon monthly portfolio valuations, and include the reinvestment of all earnings as of the payment date. The composite returns are asset-weighted based upon the beginning period market values calculated in U.S. dollars. The Benchmark for the composite is the Barclays Capital U.S. Aggregate Bond Index, presented in U.S. dollars. The composite contained fewer than 1% of non fee-paying accounts at the end of each year.
Ebert Capital Management Inc. (ECM) is an independent, fee-only registered investment adviser. Ebert Capital Management claims compliance with the Global Investment Performance Standards (GIPS®) and has prepared and presented this report in compliance with the GIPS standards. Ebert Capital Management has been independently verified for the periods Dec 1, 2010 through December 31, 2019. The verification report is available upon request. A firm that claims compliance with the GIPS standards must establish policies and procedures for complying with all the applicable requirements of the GIPS standards. Verification provides assurance on whether the firm’s policies and procedures related to composite and pooled fund maintenance, as well as the calculation, presentation, and distribution of performance, have been designed in compliance with the GIPS standards and have been implemented on a firm-wide basis. Verification does not provide assurance on the accuracy of any specific performance report.
GIPS® is a registered trademark of CFA Institute. CFA Institute does not endorse or promote this organization, nor does it warrant the accuracy or quality of the content contained herein. Policies for valuing portfolios, calculating performance, preparing GIPS Reports, and a list of composite descriptions are available upon request.
Past performance does not guarantee future results. Performance data quoted represents past performance. Current performance may be lower or higher than the performance data quoted. Past performance of markets, strategies, composites, or any individual securities is no guarantee of future results. Different types of investments involve varying degrees of risk, and there can be no assurance that any specific investment will either be suitable or profitable for a client’s portfolio. Investment in the above referenced model composite is subject to investment risks, including, without limitation: market risk, interest rate risk, management style risk, business risk, sector risk, and other risks related to equity securities. There are no assurances that a portfolio will match or outperform any particular benchmark. Historical performance results for benchmarks, such as investment indices and/or categories, generally do not reflect the deduction of transaction and/or custodial charges or the deduction of an investment-management fee, which would have the effect of decreasing historical performance results.
Standard Tiered Fee Schedule for all composites.
